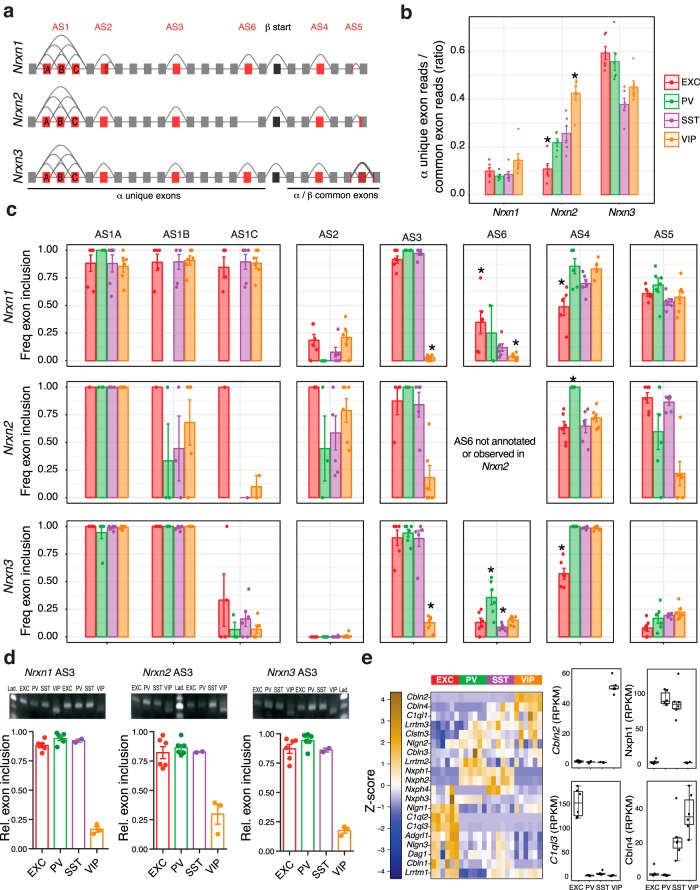
Figure 5.
Comprehensive analysis of neurexin canonical splicing. a, Gene models of Nrxns1–3, with canonical alternative splicing regions (AS1–6) in red, and the start of the β isoforms in black. b, Quantification of α isoform exon expression evidence (as a proxy for α–β isoform ratios). c, Frequency of exon inclusion for AS1–6 exons across each neuron subtype. d, Validation of AS3 differential splicing using semiquantitative RT-PCR analyses of Nrxn1, Nrxn2, and Nrxn3, using primers that surround the respective AS3 exons. Images show example gels depicting the shift in PCR product length for VIP samples relative to EXC, SST, and VIP samples. Predicted product lengths are as follows: nrxn1 204 bp with exon, 177 bp without; Nrxn2 204 bp with exon, 165 bp without; nrxn3 177 bp with exon, 138 bp without. Plots show relative proportion of detected inclusion product. Bar charts show mean ± SEM (n = 6 EXC, 6 PV, 2 SST, and 3 VIP). e, Expression of genes encoding neurexin interacting proteins as a z-score normalized heatmap of RPKM expression levels (left), and boxplots of four examples enriched or depleted in 1–2 neuron subtypes (right). *Exon inclusion in an indicated cell type is significantly different from each of the other three neuron subtypes (two-sided t test, p < 0.05).

