Figure 1.

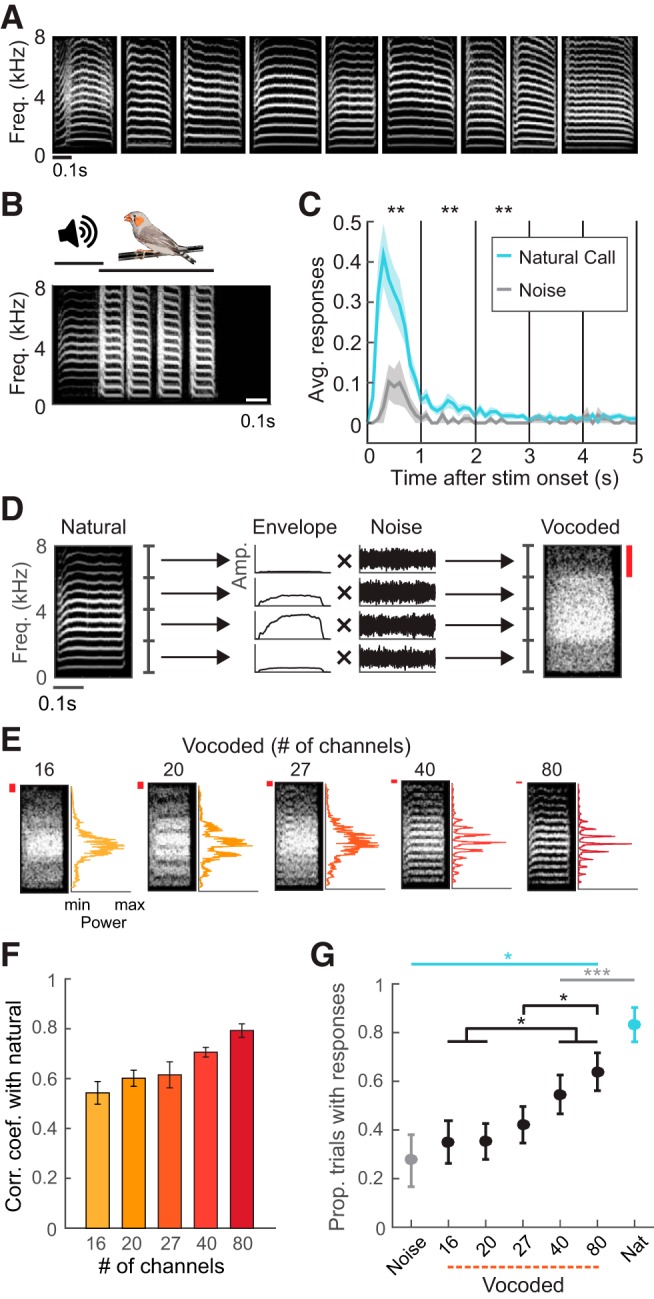
Spectral degradation decreases vocal responses to playback of calls. A, Original nine female distance calls used as stimuli. B, Example of one trial in the call-response behavior paradigm, in which presentation of a natural call evoked four response calls. C, Average number of response calls in the first 5 s following the onset of natural call and noise presentation, shown in 100 ms time bins. Asterisks indicate significant differences between responses to natural calls and noise for each 1 s period (*p < 0.01, Wilcoxon signed rank tests). D, Schematic showing how vocoded calls were generated from natural calls. The example depicts generation of a four-channel vocoded call. The natural call (left spectrogram) was decomposed into four spectral bands, and the amplitude envelope of each was extracted. Red bar indicates the width of one spectral channel. E, Example spectrograms and frequency power spectra of vocoded versions of a call showing the differences in acoustic structure across test stimuli. Red bars indicate the widths of spectral channels. F, Correlation coefficients between the frequency power spectra of vocoded calls and those of their natural call templates (mean ± SEM; N = 9). The spectral similarity of vocoded calls with natural calls increased with channel number. G, Proportion of trials in which birds produced at least one response call for each stimulus type (mean ± SEM; N = 10). Cyan and gray asterisks indicate significant differences from natural calls and noise respectively in stimulus-evoked responses. Black asterisks and brackets denote significant differences between responses evoked by vocoded calls with different numbers of channels. *p < 0.05, ***p < 0.001, rank-transformed repeated-measures ANOVA with Dunn–Sidak tests.
