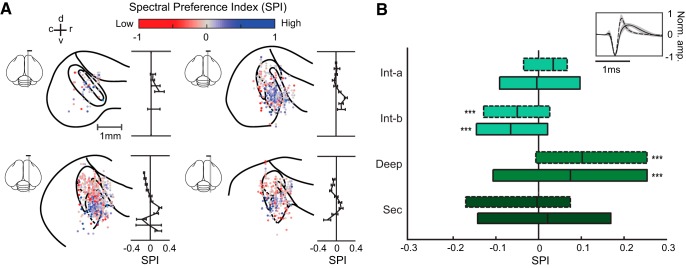
Figure 3.
Neurons selective for high spectral resolution were localized in the deep region. A, Spatial organization of SPI in the AC (N = 1154 call-responsive units). Each of the four sagittal brain diagrams show single units within a 0.3 mm range on the medial-lateral axis (estimated medial-lateral coordinates: 0.7–1.0, 1.0–1.3, 1.3–1.6, and 1.6–1.9 mm), plotted according to their rostral-caudal and dorsal-ventral coordinates. Each data point represents a single unit and is color-coded according to its SPI. To the right of each brain section diagram, average SPIs (mean ± SEM) for each dorsal-ventral position bin are plotted. Note that average SPI was only computed for bins with at least five single units recorded. B, Boxplots showing SPI distribution of pINs (dashed outlines) and pPCs (solid outlines) in each auditory region. Asterisks indicate significant differences from zero. ***p < 0.001, Wilcoxon signed rank test; intermediate-a, N(pIN, pPC) = 39, 72; intermediate-b, N(pIN, pPC) = 54, 135; deep, N(pIN, pPC) = 85, 326; secondary, N(pIN, pPC) = 28, 108 call responsive-units.

