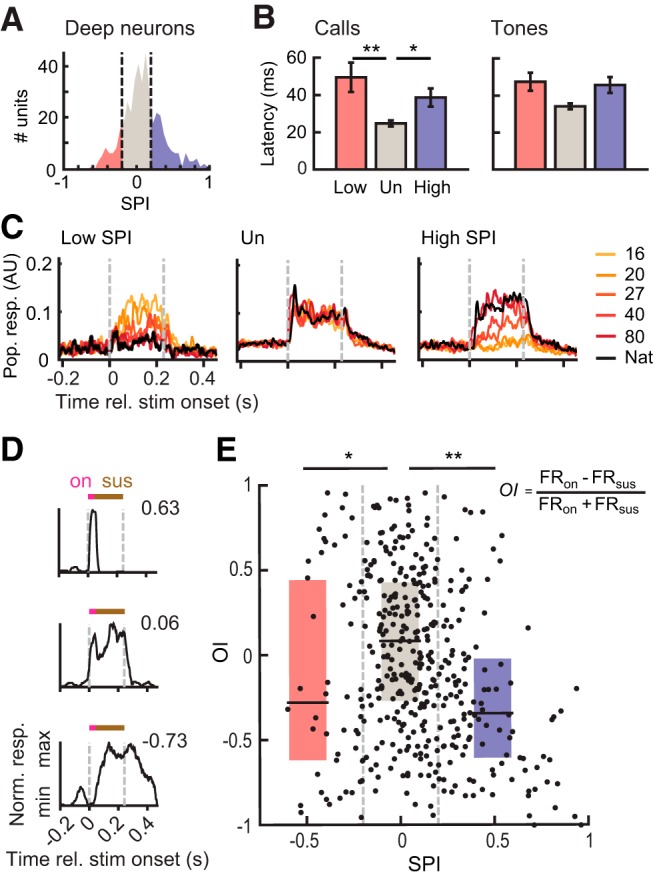
Figure 4.

Temporal response patterns differ with spectral preference index (SPI) in the deep region of auditory cortex (N = 411 call-responsive units). A, Segmentation of deep region units into low-resolution-selective (Low, red), unselective (Un, gray), and high-resolution-selective (High, blue) groups (Low, N = 52; Un, N = 239; High, N = 120). B, First-spike latencies in response to natural and vocoded calls (left) and tones (right), shown for Low, Un, and High neurons (rank-transformed ANCOVA with Dunn–Sidak tests). C, Example call-evoked pPSTHs for Low, Un, and High neurons. AU, Arbitrary units. pPSTHs to different stimulus groups are color-coded according to the legend. Responses of Un neurons peak at stimulus onset, whereas High and Low responses increase after stimulus-onset and are sustained over the duration of the stimulus. D, Example PSTHs for neurons with negative (top), near-zero (middle), and positive OI (bottom). Pink and brown bars show time periods where onset and sustained firing rates were measured. E, Scatter plot and box plots showing the relationship between OI and SPI. Onset responses are stronger in Un neurons than in High or Low neurons (Kruskal–Wallis ANOVA with Dunn–Sidak tests). For all panels, *p < 0.05, **p < 0.01.
