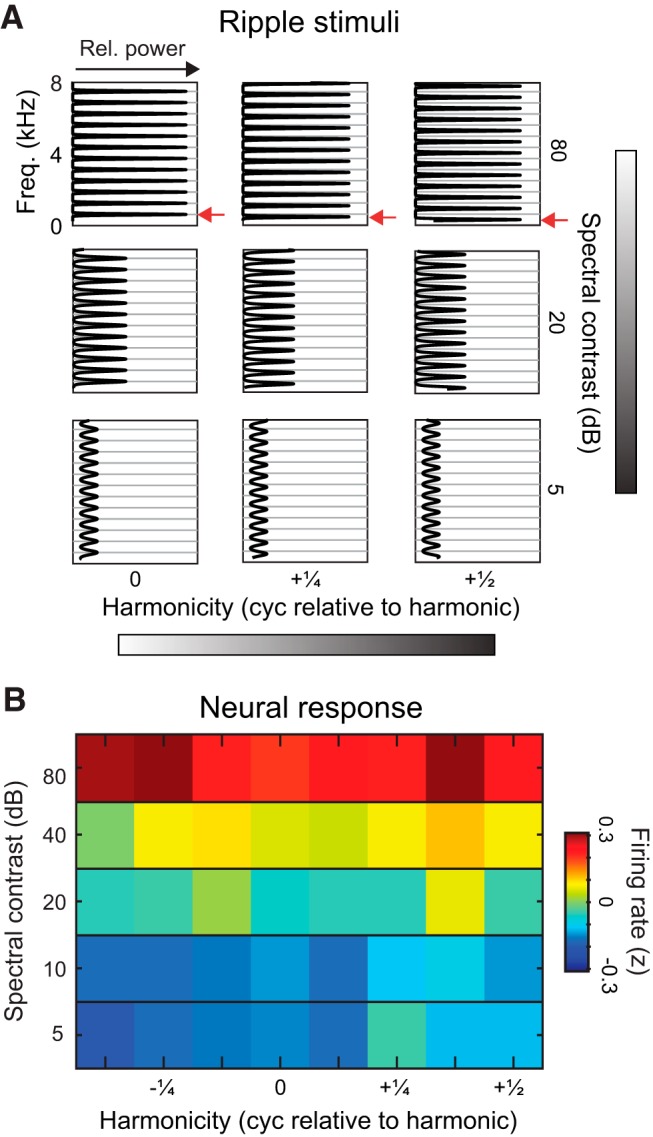
Figure 5.

Selectivity for behaviorally relevant sounds is explained by tuning for spectral contrast rather than harmonicity. A, Spectral profiles of ripples varied in spectral contrast and phase relative to harmonic phase. Gray lines indicate the peaks of frequency components if they were integer multiples of an F0 (F0 = 1000 Hz/1.6 = 625 Hz). B, Heatmap of population firing rates in response to ripples with varying phase and spectral contrast. Each pixel shows the mean z-scored firing rate across all deep region units (N = 315 ripple-responsive units).
