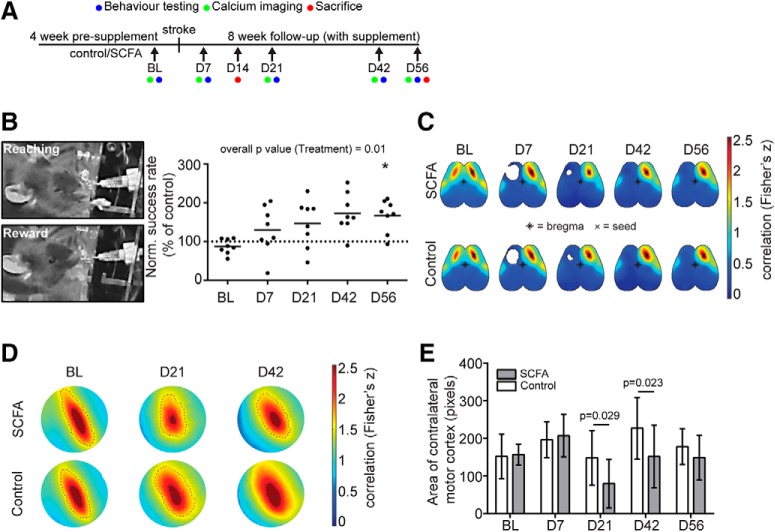
Figure 1.
SCFA supplementation improves recovery after stroke. A, Schematic diagram illustrating the timeline of SCFA supplementation and analysis time points. BL, Baseline; D, day (after stroke). See Figure 1-1). B, Representative images obtained during the lever pull test of trained mouse successfully reaching for the lever (left, above) and obtaining the peanut oil reward (left, below). Right, Normalized success rate for lever pulls by the affected (contralesional) forelimb. Relative values are shown per time point normalized to the mean of the control group. N = 8 per group. Horizontal line indicates mean. Two-way repeated measure ANOVA with Holm–Sidak's post hoc test. C, Topographic depiction of seed-based functional connectivity of both hemispheres at indicated time points of SCFAs and control-treated mice. Seed is placed in the homotypic contralesional region to the ipsilesional lesion area (i.e., the contralesional motor cortex). Color code represents Fisher's z correlation between the seed and every other pixel in the cortex. D, Enlarged images of the contralesional motor cortex (region homotypic to the infarct lesion). Area highlighted with dotted line represents the highly connected functional motor cortex area (pixels with Fisher's z values > 2.25). E, Quantification of highly correlated (Fisher's z > 2.25) area of the contralesional motor cortex in control (open bars) and SCFA-treated mice (gray bars). N = 15 per group. Multiple t tests per time point with Holm–Sidak's correction for multiple testing.

