
Figure 5.
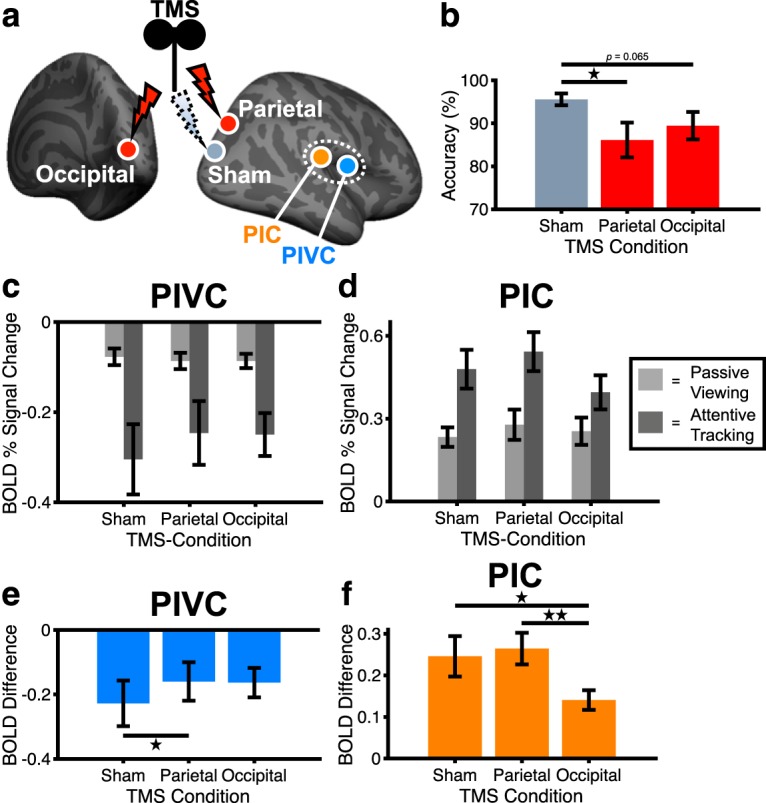
Effects of rTMS on attentional tracking performance and BOLD. a, Locations in PPC and OC for inhibitory rTMS. An intermediately located region was chosen for sham rTMS (for the anatomical locations, see Fig. 4). b, Mean (± SE) behavioral performance during attentive tracking after inhibitory rTMS (n = 15 subjects). c, d, Mean (± SE) BOLD activity in PIVC and PIC during passive viewing (light gray) and attentive tracking (dark gray) after inhibitory rTMS (n = 15 subjects). Zero on the y axis indicates activity during blank baseline while participants kept their eyes open. e, f, Mean (± SE) attention-modulated BOLD activity in PIVC and PIC following inhibitory rTMS (n = 15 subjects). Values on the y axis correspond to the activity difference between attentive tracking and passive viewing (see c, d). Significant differences between conditions: *p < 0.05, **p < 0.01.