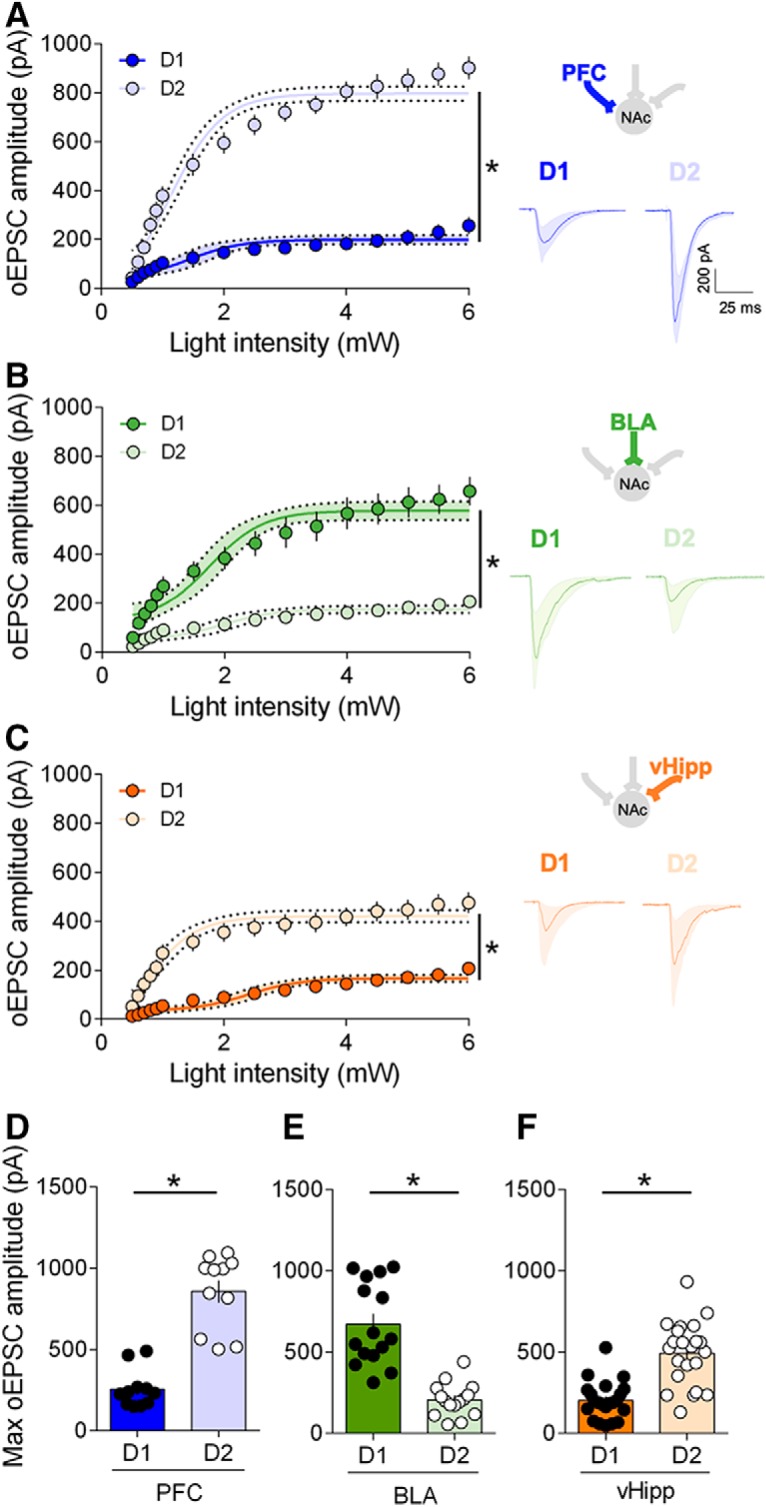
Figure 3.

Hierarchy of optically driven synaptic inputs depends on the cellular identity of the target MSNs. A, Left, At PFC fibers, the largest excitatory oEPSCs in response to increasing light stimulations were recorded in D2 MSNs (light blue, n = 17) compared with D1 MSNs (dark blue, n = 11) (F(interaction 15,416) = 18.59, p < 0.0001, F(cell type 1,416) = 934.4, p < 0.0001, two-way repeated measure ANOVA). Right, Example oEPSC traces for PFC inputs onto D1 and D2 MSNs. B, Left, At BLA fibers, the largest excitatory oEPSCs in response to increasing light stimulations were recorded in D1 MSNs (dark green, n = 20) compared with D2 MSNs (light green, n = 15) (F(interaction 15,528) = 5.628, p < 0.0001, F(cell type 1,528) = 331.5), p < 0.0001, two-way repeated measure ANOVA). Right, Example oEPSC traces for BLA inputs onto D1 and D2 MSNs. C, Left, At vHipp fibers, the largest excitatory oEPSCs in response to increasing light stimulations were recorded in D2 MSNs (light orange, n = 22) compared with D1 MSNs (dark orange, n = 24) (F(interaction 15,704) = 4.310, p < 0.0001, F(cell type 1,704) = 491.3, p < 0.0001, two-way repeated measure ANOVA). Right, Wxample oEPSC traces for vHipp inputs onto D1 and D2 MSNs. D, Summary bar histogram showing maximum oEPSCs at PFC inputs onto D1 and D2 MSNs. (D1 MSNs n = 11, D2 MSNs n = 11, p < 0.0001, Mann–Whitney U test). E, Summary bar histogram of maximum oEPSCs at BLA inputs in neighboring D1 and D2 MSNs (D1 MSNs n = 15, D2 MSNs n = 15, p < 0.0001, Mann–Whitney U test). F, Summary bar histogram of maximum oEPSCs at vHipp inputs in neighboring D1 and D2 MSNs neighboring (D1 MSNs n = 22, D2 MSNs n = 22, p < 0.0001, Mann–Whitney U test). Individual point in scatter dot plots represents one individual neuron. The line between dots shows neighboring D1 and D2 neurons that were recorded in the same slice with the same optical fiber position. All data are shown as mean ± SEM or geometric mean ± CI. *p < 0.05.
