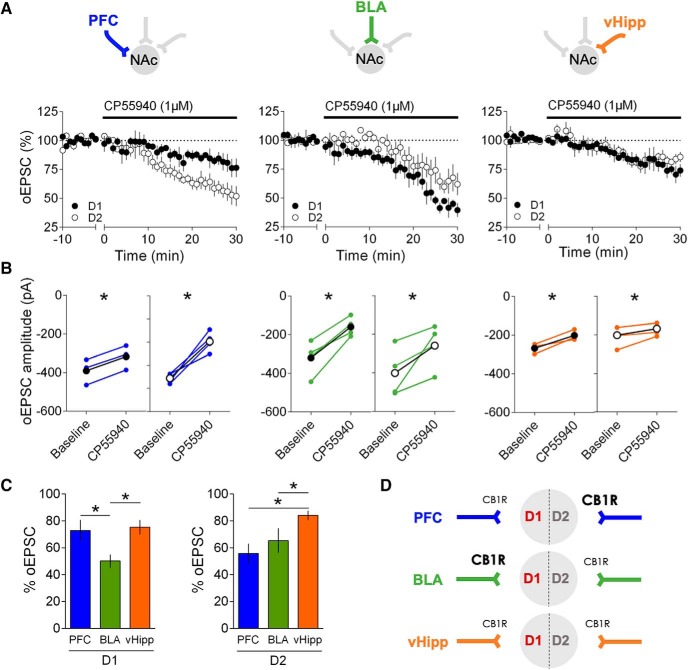
Figure 6.
CB1R inhibition is common to all inputs onto D1 and D2 NAc core MSNs. A, Bath application of the synthetic CB1R agonist CP55940 (1 μm), inhibited oEPSC in D1 (black) and D2 (white) MSNs. CP55940 was applied for 30 min (black bar) after at least 10 min of stable baseline recording. B, Individual and averaged oEPSCs amplitude experiments before (baseline) and 25–30 min after CP55940. (D1 MSNs, black circles: PFC n = 3, p = 0.0014, BLA n = 4, p = 0.0110, vHipp n = 3, p = 0.0411; D2 MSNs, white circles: PFC n = 4, p = 0.0114, BLA n = 4, p = 0.0188, vHipp n = 4, p = 0.0496 paired t test). C, Summary bar histogram comparing CP55940-induced inhibition of oEPSCs at identified PFC, BLA and vHipp inputs onto D1 (PFC n = 3, BLA n = 4, vHipp n = 3, F(input 2,7) = 14.32, p = 0.0034, one-way ANOVA) and D2 MSNs (PFC n = 4, BLA n = 4, vHipp n = 4, F(input 2,9) = 4.207, p = 0.0513, one-way ANOVA). D, Schematic view of the relative weight of CB1R-mediated inhibition at PFC, BLA and vHipp inputs onto D1 and D2 MSNs. n represents the number of mice. All data are shown as mean ± SEM. *p < 0.05.

