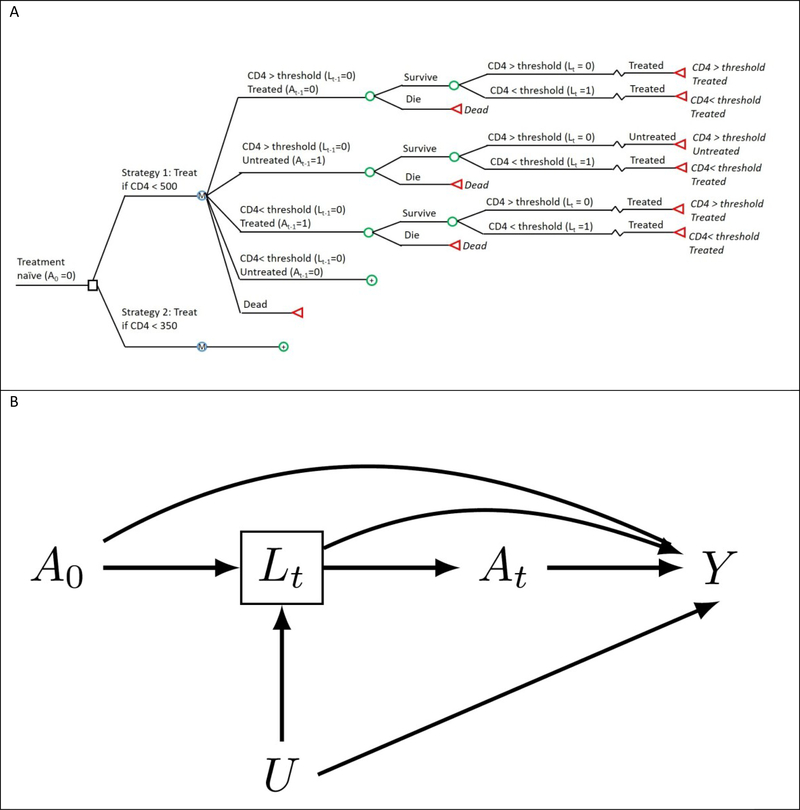
Figure 1.
The structure of the simulated example as (A) a decision model and (B) directed acyclic graph (DAG). (A) The decision model depicts the decision process at a single time-step, with the circular decision nodes indicating probabilistic events and the colored square decision node indicating an intervention point. (B) The directed acyclic graph depicts two arbitrary time points of the same causal structure for a time- varying treatment, A0 and At, an outcome, Y, a time-varying confounder, Lt, affected by prior treatment (A0), and an unmeasured outcome cause, U.

