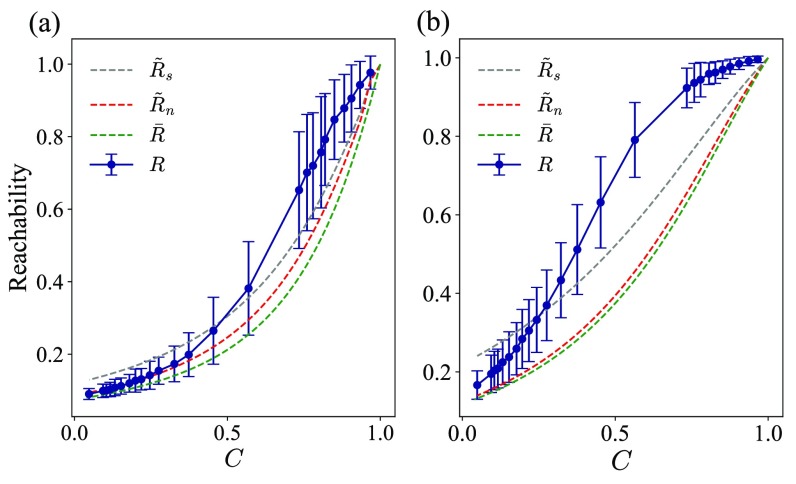
FIG. 4.
Simulated and approximate reachability on sparse ER networks as a function of temporal concurrency . Largest connected components for two different size networks are tested: (a) and (b) . The solid line indicates the numerically measured reachability simulated over 100 ER networks for each size. Error bars indicate standard deviations. Dashed lines indicate the different approximations for the reachability.

