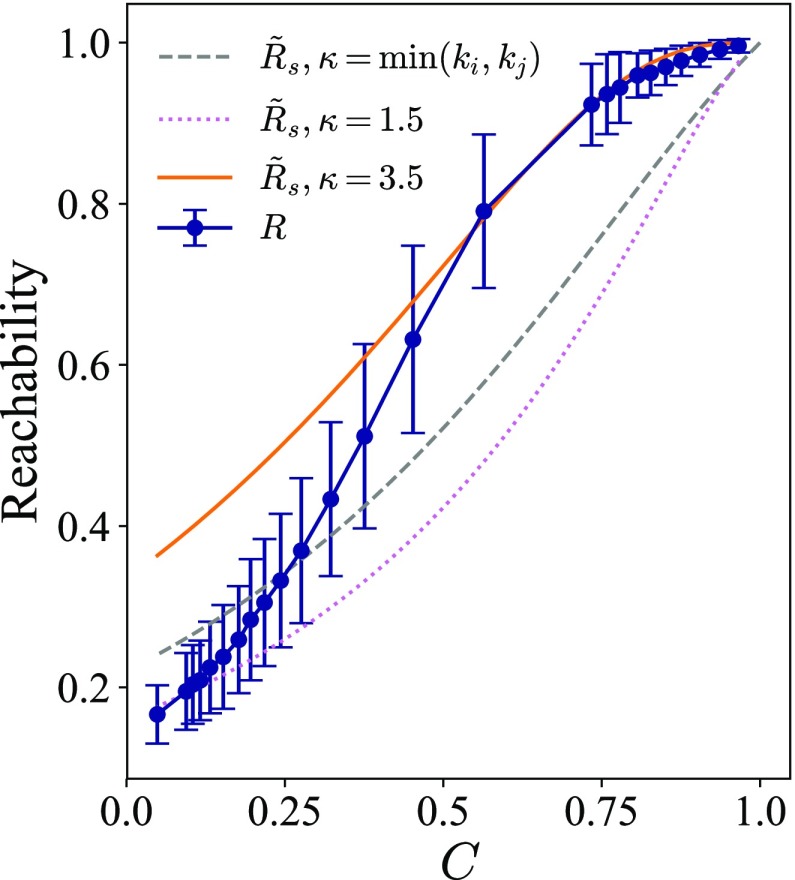
FIG. 7.
Fit of for the reachability of ER network largest connected components with . The circles with error bars and the gray dashed line represent the numerical reachability and approximation with the shortest path length distribution, respectively. The dotted line shows recalculated with constant , while the solid curve uses as the exponent in Eq. (10) for all node pairs.

