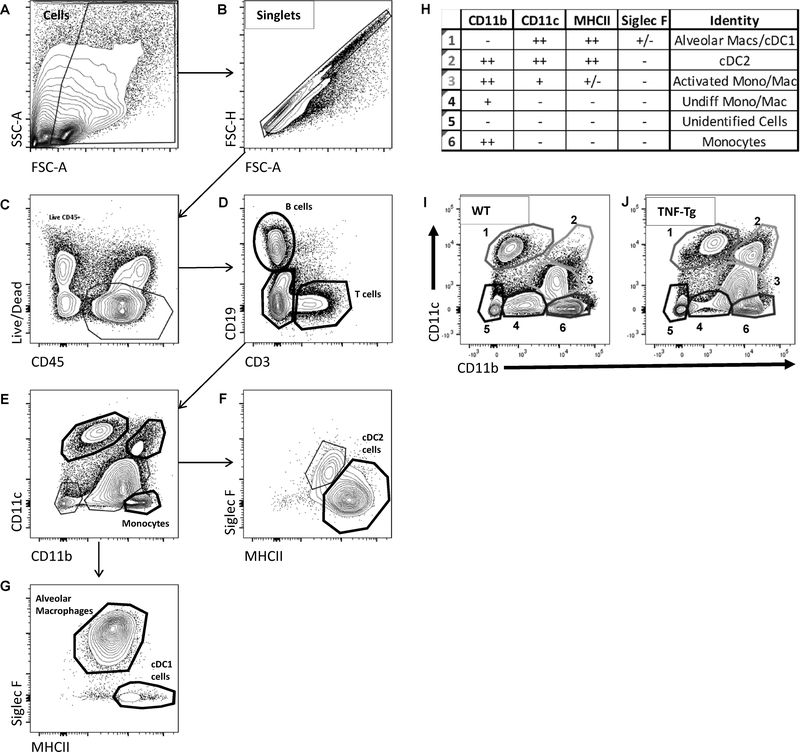
Figure 1. Flow cytometry identifies upregulated myeloid cell populations in TNF-Tg lungs.
Single-cell suspensions of mouse lung digests were analyzed by flow cytometry following fluorescently labeled antibody staining, and analyzed using a sequential gating strategy. After the gating of single cells (A & B), live leukocytes were identified using CD45 and a Live/Dead stain (C). B and T cells were identified with the use of CD19 and CD3 markers (D). From the Live,CD45+CD3-CD19- cells, myeloid populations were analyzed with the use of CD11b, CD11c, MHCII, and Siglec F (E-G). Individual isolated populations were consistent with alveolar macrophages, cDC1s, cDC2s, and monocytes at various stages of activation and transition into macrophages. Population identities with associated marker profiles are listed (H). Representative contour plots for myeloid populations in WT and TNF-Tg animals demonstrate a difference in profile, specifically regarding populations 2 and 3 (I & J).

