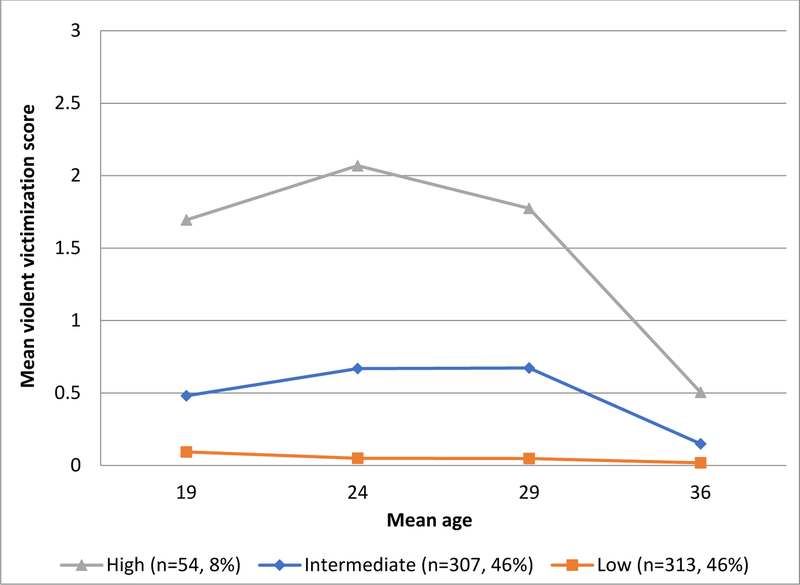
Figure 1.
Trajectories of violent victimization from late adolescence to the mid-thirties, Harlem Longitudinal Development Study, n=647. Mean violent victimization score is computed as the average of four items assessing frequency of violent victimization experiences including (1) being threatened with a weapon, (2) being hit with a weapon or shot, (3) being cut/stabbed with a knife, and (4) being beaten up (Chavez & Oetting, 1994). Response options ranged from (0) never to (4) five or more times.

