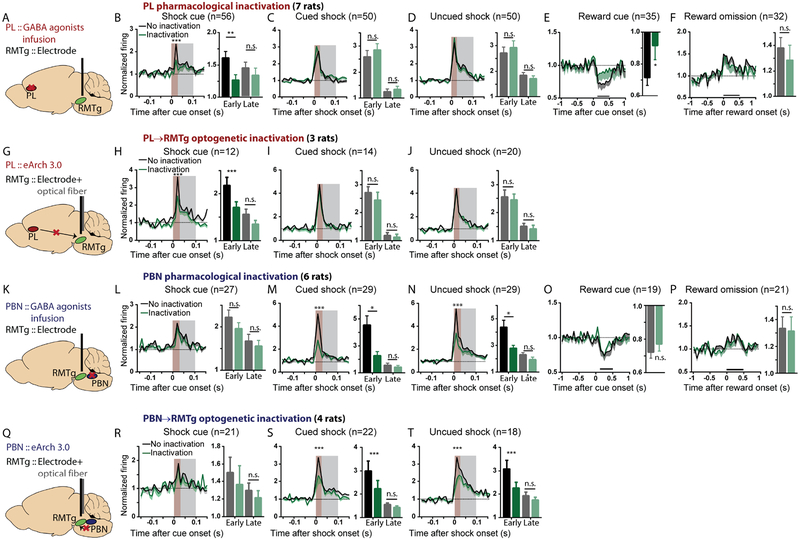
Figure 3. The prelimbic cortex (PL) and parabrachial nucleus (PBN) drive RMTg activations by predictive cues and shocks, respectively.
(A, G, K, Q) Illustrations of pharmacological and optogenetic inhibition. Trial designs were the same as in Figures 2A, C. (B-F, H-J) PL inactivation selectively attenuated RMTg early phase (0–30ms, brown shaded stripe) responses to shock cues and reward cues, but not other stimuli (p=0.0038 and p=0.2777, p=0.1331 and p=0.5463, p=0.4690 and p=0.5075 for early and late components of shock cue, cued shock, and free shock, respectively; p=0.0264 and p=0.3924 for reward cue and reward omission). (L-P, R-T) PBN inactivation selectively attenuated RMTg early phase responses to shocks, without affecting other responses (p=0.1484 and p=0.4233, p=0.0009 and p=0.8003, p<0.0001 and p=0.2680, for early and late responses to shock cue, cued shock, and uncued shock, respectively; p=0.2011 and p=0.8521 for reward cue and reward omission). Neurons that were not inhibited by reward cues or not activated by shock cues, shocks, or reward omission were excluded from analyses in Figures 2 and 3, but data for all neurons, along with histology, are shown in Figures S2, S3, and S4. All p values are from paired t-tests and repeated measures two-way ANOVA, with Holm-Sidak multiple comparisons post-hoc tests. Brown and grey shaded areas: early and late phases.

