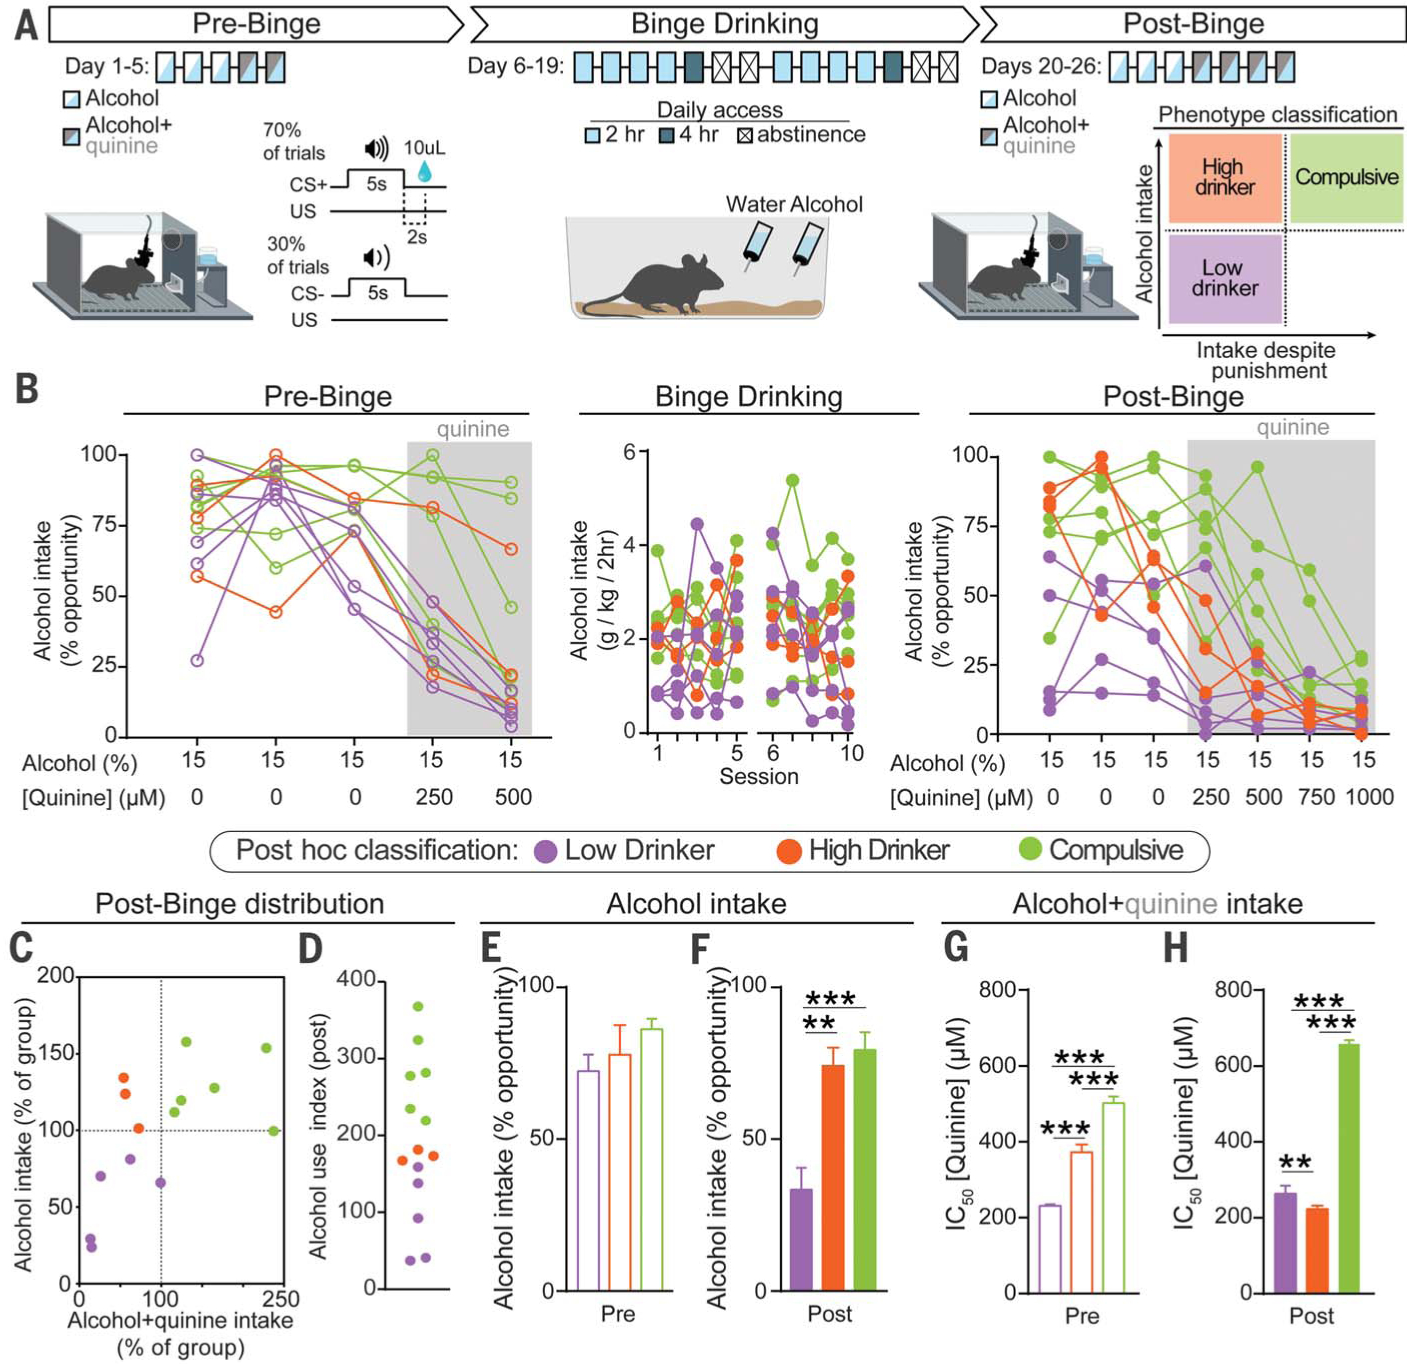
Fig. 1. Binge-induced compulsion task (BICT) for tracking the emergence of individual differences in compulsive alcohol drinking.

(A) Schematic of the BICT. (B) Individual animals’ alcohol consumption. (C) Normalized distributions of alcohol and alcohol+quinine consumption during the post-binge conditioning phase plotted to classify each animal’s alcohol-drinking phenotype, which was applied post hoc to the dataset. (D) Alcohol use index. (E) Average performance across the pre-binge alcohol-only sessions (days 1 to 3) did not differ between groups [one-way analysis of variance (ANOVA), F(2,11) = 1.922, p = 0.19]. (F) During post-binge conditioning sessions, high drinkers and compulsive animals consumed more alcohol (one-way ANOVA, F(2,11) = 15.41, p = 0.0006). (G) Concentration required to produce an IC50 calculated from pre-binge conditioning data (one-way ANOVA, F(2,11) = 430.3, p < 0.0001). (H) After binge drinking, compulsive animals exhibited robust punishment-resistant alcohol intake compared with both low and high drinkers (one-way ANOVA, F(2,11) = 1298.0, p < 0.0001). All post hoc comparisons used Tukey’s test: **p < 0.01; ***p < 0.001. Error bars indicate ± SEM.
