. 2019 Dec 16;8:e52465. doi: 10.7554/eLife.52465

Figure 4. Exemplary illustration of individuals (Data set 1) that switch from being classified as ‘learners’ vs. ‘non-learners’ depending on the different CS+/CS– discrimination cutoff level (panels A–D), when calculation of CS+/CS– discrimination is based on either the full fear acquisition phase or the second half of the fear acquisition training (left and right part of each panel, respectively).

Figure 4.

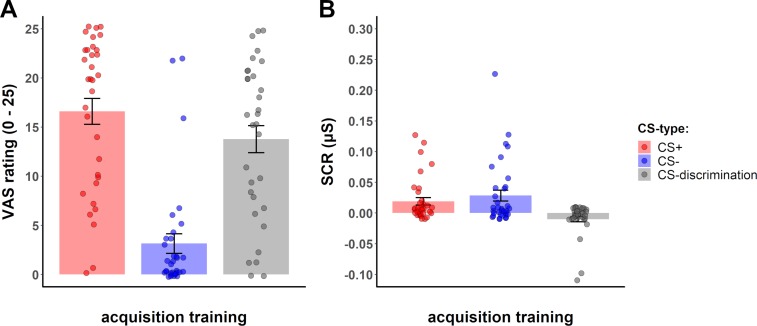
Figure 4—figure supplement 1. Bar plots (mean ± SE) on which the superimposed individual data points show CS+ and CS– amplitudes (of raw SCR values) and CS+/CS– discrimination in (A) fear ratings and (B) SCRs raw values in the group of ‘non-learners’, as exemplarily defined for this example as a group consisting of individuals in the two lowest SCR CS+/CS– discrimination cutoff groups (i.e., ≤0) in Data set 1.

Figure 4—figure supplement 1.

This illustrates that individuals who fail to show CS+/CS– discrimination in SCRs (B) may in fact show substantial CS+/CS– discrimination (as an indicator for successful learning) in other outcome measures, as exemplarily illustrated here for fear ratings (A).