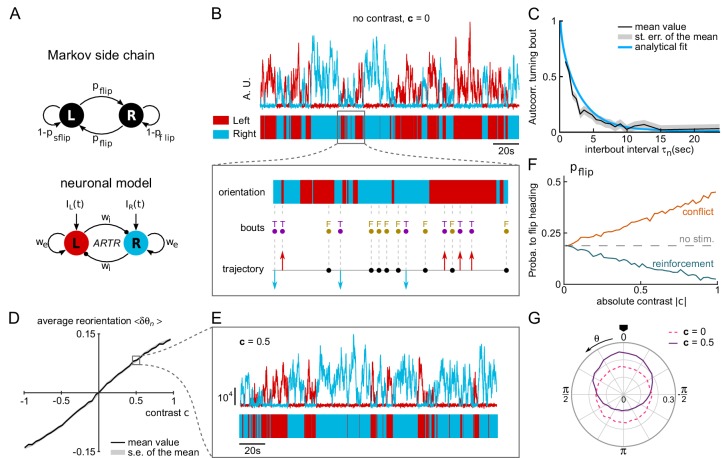
Figure 5. A neuronal model of turning bout selection captures spontaneous and contrast-driven navigation.
(A) Scheme of the Markov-chain model of the orientation selection, and corresponding neuronal model of the ARTR. The latter consists of two units whose relative activation controls the orientation of bouts. Persistent and self-alternating dynamics result from the recurrent excitation () and reciprocal inhibition () between each unit. They further receive input currents proportional to the illumination of the ipsilateral eye. (B) Top: example traces of the simulated activity of the left (red) and right (blue) modules in the absence visual stimulation (AU : arbitrary units). These continuous dynamics control the alternation between right and left orientational states. Close-up: forward and turning bouts are triggered independently with a statistics drawn from the behavioral recordings. The orientational state governs the orientation of the turning bouts. (C) Orientation correlation of turning bouts (thresholded at 0.22 rad) as a function of the inter-bout interval . Result from the neuronal model is in blue, experimental data are in black. (D) Mean reorientation as a function of the contrast . (E) Example traces of the simulated activity for a constant contrast . (F) Probability of flipping orientation as a function of the imposed contrast in situations of conflict or reinforcement (neuronal model). (G) Probability distribution function of for 10 simulated phototactic trajectories with a linear dependence of average reorientation on contrast. Each trajectory lasted 50,000 s. The dotted line is the orientational distribution in the absence of visual stimulation.


