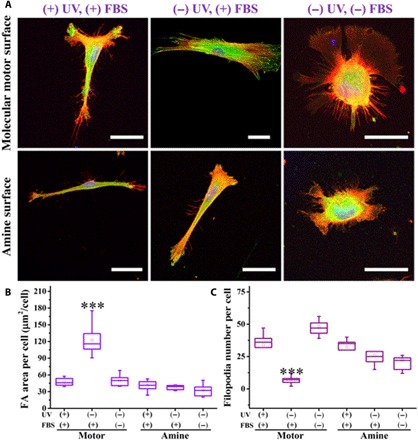
Fig. 3. Subcellular characteristics on the molecular motor and amine surfaces.

(A) Fluorescent images of a single hBM-MSC cultured on molecular motor and amine surfaces under different conditions for 12 hours. Red staining is F-actin, visualized by TRITC-phalloidin staining, and blue staining is nucleus, stained by DAPI; green staining is vinculin. Scale bars, 40 μm. (B and C) FA area per cell and filopodia number per cell on molecular motor and amine surfaces under different conditions (n = 3), respectively. Data reported as means ± SD (***P < 0.001).
