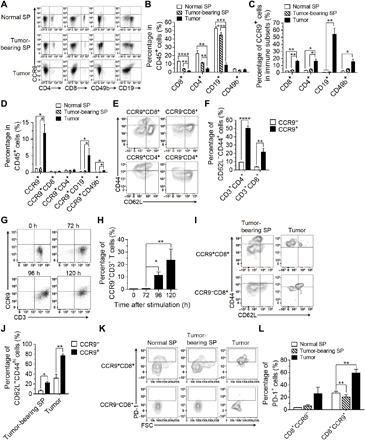
Fig. 1. Activated characteristics of CCR9+ T cells in spleen and 4T1 tumors.

Spleens and tumors were harvested from 4T1 tumor–bearing mice when tumor volume was about 500 mm3 and analyzed for surface CCR9 expression in splenic lymphocytes and TILs. Spleen cells from normal BALB/c mice were used as controls. (A) Representative flow cytometry plots demonstrating the CCR9+ cells in CD4+, CD8+, CD49b+, and CD19+ cells in CD45+ cells in the spleens and tumors. (B) Frequencies of CD4+ T cells, CD8+ T cells, B cells, and NK cells in CD45+ cells in spleens and 4T1 tumors. (C) Frequencies of CCR9+ cells in CD4+ T cells, CD8+ T cells, B cells, and NK cells in the spleens and 4T1 tumors. (D) Frequencies of CCR9+ cells, CCR9+CD4+ T cells, CCR9+CD8+ T cells, CCR9+ B cells, and CCR9+ NK cells in CD45+ cells in the spleens and 4T1 tumors. (E and F) Representative flow cytometry plots (E) for gating strategy to define frequencies (F) of CD62L−CD44hi cells in CCR9+CD8+, CCR9+CD4+ (CCR9+CD3+CD8−) and CCR9−CD8+, and CCR9−CD4+ (CCR9−CD3+CD8−) T cells isolated from the spleens harvested from normal BALB/c mice. (G and H) CCR9−CD3+ T cells were purified from the spleen of normal BALB/c mice and activated for 5 days by plating 2 × 10⁵ cells in plates coated with CD3 and CD28 antibodies. Representative flow cytometry plots showing CCR9 expression on CD3+ T cells (G) and frequencies of CCR9+ cells in CD3+ T cells (n = 4 per group) (H) at 0, 72, 96, and 120 hours after activation. (I and J) Representative flow cytometry plots (I) and frequencies (J) CD62L−CD44hi cells in CCR9+CD8+ and CCR9−CD8+ T cells in the spleens and 4T1 tumors when tumor volumes were about 500 mm3 (n = 3 to 4 per group). (K and L) CCR9+CD8+ and CCR9−CD8+ T cells were prepared from the spleens (SP) of normal BALB/C mice and the spleens and tumors of 4T1 tumor–bearing BALB/c mice (tumor volumes were about 500 mm3) and analyzed for PD-1 expression by flow cytometry. (K) Representative flow cytometry profiles showing PD-1 expression in gated CCR9+CD8+ and CCR9−CD8+ T cells. (L) Frequencies of PD-1+ cells in CCR9+CD8+ and CCR9−CD8+ T cells (n = 3 to 4 per group). Data are presented as means ± SEM. *P < 0.05; **P < 0.01; ***P< 0.001; ****P < 0.0001.
