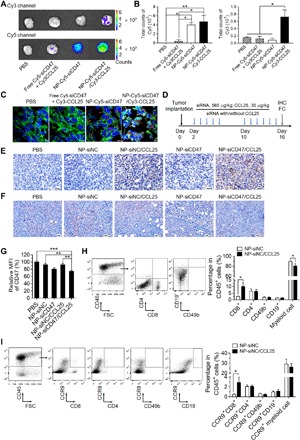
Fig. 3. NP-siCD47/CCL25 significantly down-regulates the expression of CD47 in 4T1 tumor cells and enhances the infiltration of CCR9+ cytotoxic T cells into tumor tissues.

(A) Fluorescent images of 4T1 tumors harvested at 24 hours after intravenous injection of PBS, free Cy5-siCD47 + Cy3-CCL25, NP-Cy5-siCD47, and NP-Cy5-siCD47/Cy3-CCL25. The CD47 siRNA and CCL25 were labeled with Cy5 and Cy3, respectively. (B) Corresponding quantification of Cy5 (left) and Cy3 (right) signals in tumor tissues in (A). (C) CLSM images showed the distribution and cellular uptake of Cy5-labeled CD47 siRNA (red arrowheads) and Cy3-labeled CCL25 (yellow arrowheads) in tumor tissues in (A). The cell membrane and nuclei were stained with phalloidin-FITC (green) and DAPI (blue), respectively. Scale bar, 5 μm. (D) Schedule of treatment of the tumor-bearing mice with drug-loaded nanoparticles. CD47 siRNA or negative control siRNA-loaded nanoparticle (NP-siCD47 or NP-siNC), siRNA and CCL25 coloaded nanoparticle (NP-siCD47/CCL25 or NP-siNC/CCL25), or PBS was introduced via tail vein injection from the second day after 4T1 tumor implantation (3 × 10⁵ cells per mouse). The doses of siRNA and CCL25 were 565 and 35 μg/kg in each injection, respectively. (E and F) IHC analysis of CCL25 (E) and CD47 expression (F) in tumor tissues treated by PBS, NP-siNC, NP-siNC/CCL25, NP-siCD47, and NP-siCD47/CCL25 as scheduled in (D). (G) MFI of CD47 in CD45− cells in tumors harvested from tumor-bearing mice after injection of PBS, NP-siNC, NP-siNC/CCL25, NP-siCD47, and NP-siCD47/CCL25 as schedule in (D) (n = 7 to 9 per group). (H) Representative flow cytometry plots demonstrating the CD8+, CD4+, CD19+, and CD49b+ cells in CD45+cells in tumors harvested from tumor-bearing mice after NP-siNC or NP-siNC/CCL25 injection as scheduled in (D) [(H), left]. Frequencies of CCR9+ cells, CD8+ T cells, CD4+ T cells, CD49b+ NK cells, CD19+ B cells, and myeloid cells in tumor-infiltrating CD45+ cells harvested from tumor-bearing mice after NP-siNC or NP-siNC/CCL25 injection as scheduled in (D) (n = 8 to 9 per group) [(H), right]. FSC, forward scatter. (I) Representative flow cytometry plots exhibiting CCR9+ immune subsets in CD45+ cells in tumors treated by NP-siNC or NP-siNC/CCL25 as scheduled in (D) (n = 8 to 9 per group) [(I), left)]. Frequencies of tumor-infiltrating CCR9+CD8+ T cells, CCR9+CD4+ T cells, CCR9+CD49b+ NK cells, CCR9+CD19+ B cells, and CCR9+ myeloid cells in CD45+ cells in tumors treated by NP-siNC or NP-siNC/CCL25 as scheduled in (D) (n = 8 to 9 per group) [(I), right]. Data are presented as means ± SEM. *P < 0.05; **P < 0.01; ***P < 0.001.
