
Fig. 4. BRCA2mut/+ LP cells display increased TP53 activity and suppressed NF-κB/SASP pathway expression.
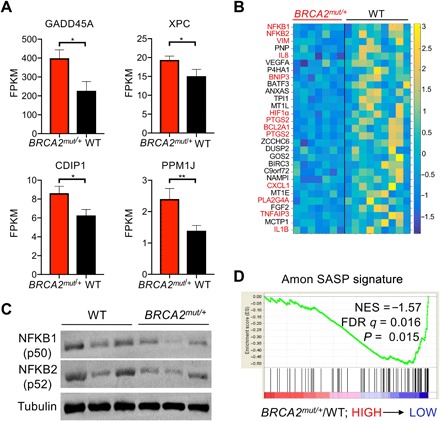
(A) Bar charts show the mean expression levels of canonical TP53 target genes in freshly sorted BRCA2 carrier LP cells (n = 7 patients) compared to controls (WT; n = 9 patients), assessed by RNA-seq. Error bars denote SEM. P values are determined by Mann-Whitney test. *P < 0.05 and **P < 0.01. XPC, Xeroderma pigmentosum group C-complementing protein; FPKM, Fragments Per Kilobase of transcript per Million mapped reads. (B) Heat map depicts down-regulation of NF-κB/SASP pathway genes in BRCA2 carrier LP cells compared to controls (WT), assessed by RNA-seq as in (A). Columns correspond to individual patients. Direct NF-κB target genes are highlighted in red. (C) Western blot analysis shows that NFKB1 (p50) and NFKB2 (p52) subunits are expressed at lower levels in BRCA2mut/+ breast tissues compared to control (WT) tissues (n = 3 patients per genotype). β-Tubulin serves as a loading control. (D) Negative enrichment of a SASP signature in GSEA of RNA-seq data from freshly sorted LP cells of BRCA2 carriers (n = 7 patients) and controls (WT; n = 9 patients). NES, normalized enrichment score; FDR, false discovery rate.