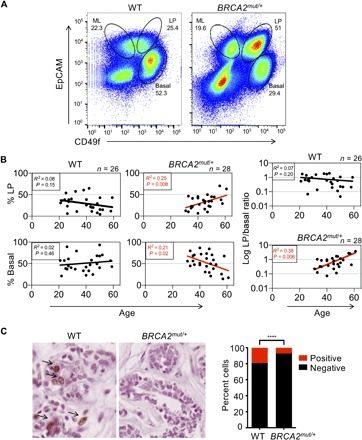
Fig. 5. Noncancerous breast tissues of BRCA2 mutation carriers demonstrate age-associated deregulation of epithelial cell proportions compared to controls.

(A) Representative flow cytometry analysis showing distinct epithelial subpopulations (basal, LP, and ML) isolated from breast tissues of control (WT) and BRCA2 mutation carriers following sorting via CD49f and EpCAM staining. Numbers indicate percentages of each epithelial cell subpopulation. (B) Linear regression analysis of LP and basal cell proportions by age for controls (WT) (n = 26 patients) and BRCA2 carriers (n = 28 patients). The LP/basal ratio by patient provides additional validation as it accounts for technical factors that may have subtle effects on absolute cell numbers. (C) TUNEL (terminal deoxynucleotidyl transferase–mediated deoxyuridine triphosphate nick end labeling) staining of representative control (WT) and BRCA2 carrier tissues. Summary data obtained by counting four fields for five patients per genotype are shown. ****P < 0.0001 by Fisher’s exact test.
