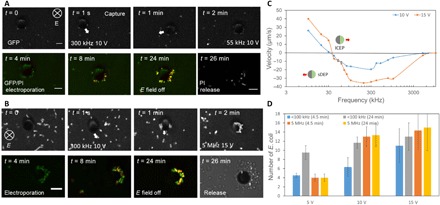
Fig. 2. Sequential trapping, electroporation, and release of E. coli.

Trapping was conducted at 300 kHz and 10 V, with a moving JP, while electroporation was performed at either (A) 50 ± 20 kHz (see movie S2 and fig. S3) or (B) 5 MHz (see movie S3), where the JP was immobile, as evident from (C), depicting the JP particle velocity versus frequency (see movie S1). The applied voltage in the electroporation stage varied, but results of the case of 10 and 15 V are shown here. (D) Number of E. coli trapped between the JP and the ITO glass, including at the JP equator, at the low (50 ± 20 kHz)- and high (5 MHz)-frequency regimes, for different operation times, and varying voltages. Error bars represent SD computed from three independent tests. Scale bars, 5 μm.
