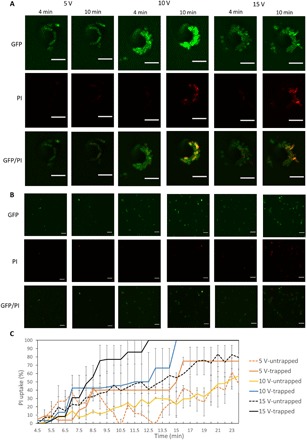
Fig. 4. Microscopy images of PI-stained trapped versus nontrapped E. coli at high frequency (5 MHz), various applied voltages, and operation times.

PI uptake (red fluorescence) indicates cell electroporation. (A) Trapped and (B) untrapped E. coli are shown. (C) Percentage of both trapped and untrapped PI-stained E. coli at various applied voltages (5 MHz). Error bars represent SD computed from three independent tests. JP of 10 μm in diameter was used. Scale bars, 5 μm. E. coli strain XL1-Blue bacteria with GFP labeling were used.
