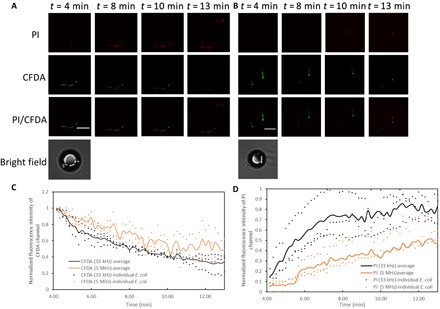
Fig. 5. Microscopy images of CFDA and PI-stained trapped E. coli at both low (33 kHz) and high (5 MHz) frequency, 10 V, and various operation times.

CFDA (green fluorescence) indicates cell viability, and PI uptake (red fluorescence) indicates cell electroporation. (A) Low-frequency (33 kHz) and (B) high-frequency (5 MHz) trapped E. coli. (C and D) Normalized fluorescence intensity (i.e., ratio of the overall fluorescence intensity within a circle of 3 μm in diameter around each bacteria to its maximum overall fluorescence intensity value) of trapped E. coli in (C) CFDA channel and (D) PI channel for both low (33 kHz) and high (5 MHz) frequencies. Continuous lines represent averaged values of the individual bacteria depicted as points. JPs of 10 μm in diameter were used. Scale bars, 5 μm. E. coli strain XL1-Blue bacteria without GFP labeling were used.
