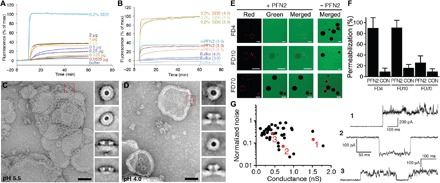
Fig. 4. Pore-forming activity of mPFN2.

Liposome leakage assay of purified mPFN2 protein incubated with liposomes containing 50% PC, 10% PS, and 40% E. coli total lipid extract. Liposome leakage was monitored by measuring fluorescence of released sulforhodamine B, and 0.2% SDS treatment was used as a positive control of 100% dye leakage. (A) Liposome leakage was dependent on mPFN2 concentration. (B) Increased sulforhodamine B release was observed with liposomes preformed at acidic pH (4.0 and 3.0) compared to at pH 5.5. Final leakage of sulforhodamine B is expressed as mean ± SD from three technical replicates, as shown in fig. S4 (B and C). All data shown are representative of three independent experiments. (C) Representative negative-stain micrograph and 2D class averages of mPFN2 incubated with liposomes containing 50% PC, 10% PS, and 40% E. coli total lipid extract at pH 5.5, with a dashed red box showing a side view of a membrane-bound pre-pore. Scale bar, 50 nm. (D) Representative negative-stain micrograph and 2D class averages of mPFN2 incubated with liposomes containing 40% PC, 30% PE, and 30% SM at pH 4.0; the lumen of the pores is much bigger than that of the pre-pores shown in (C). A dashed red box highlights a side view of a pore. Scale bar, 50 nm. (E) Permeabilization of GUVs composed of POPC:POPS:E. coli lipid extract (80:10:10; w/w) (+ rhodamine-DHPE; red channel) by addition of PFN2 (0.1 mg/ml) and fluorescent dextrans (FDs) at pH 5.7, after 60-min (FD4, 4 kDa) or 120-min (FD10 and FD70, 10 and 70 kDa) incubation. Scale bar, 20 μm. (F) Quantification of GUV permeabilization from conditions shown and described in (E). CON denotes control sample without addition of PFN2. (G) Pore formation of PFN2 on planar lipid bilayers composed of POPC:POPS:E. coli lipid extract (70:10:20; w/w) at 10 mM MES and 500 mM NaCl (pH 5.5). The red numbers on the graph correspond to the three traces shown (right). The loss of pore conductance in traces 2 and 3 is likely due to the loss of pore structures from membranes.
