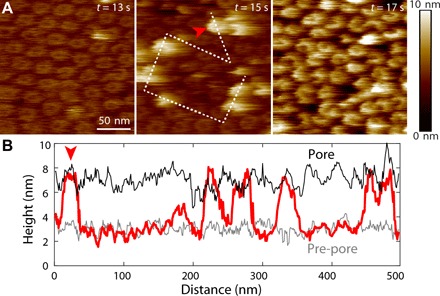
Fig. 5. Pre-pore–to–pore transition observed by HS-AFM.

(A) HS-AFM image (left) of mPFN2 on an E. coli lipid bilayer as in Fig. 3B then (middle and right) images of the same area as the pH is reduced to 3.6 to 4.0. An increase in oligomeric height results in a sharpening of the AFM image as the oligomers come more closely into contact with the cantilever tip. (B) Height profile of the transit shown with a white dashed line in (A) (middle), confirming an increase in oligomeric height above the targeted lipid bilayer on acid-triggered pore formation. The gray, red, and black lines indicate the height profile of pre-pore, mid-transition, and pore states, individually, along the path defined by the dashed line in (A). The red arrowheads in (A) and (B) show the same position.
