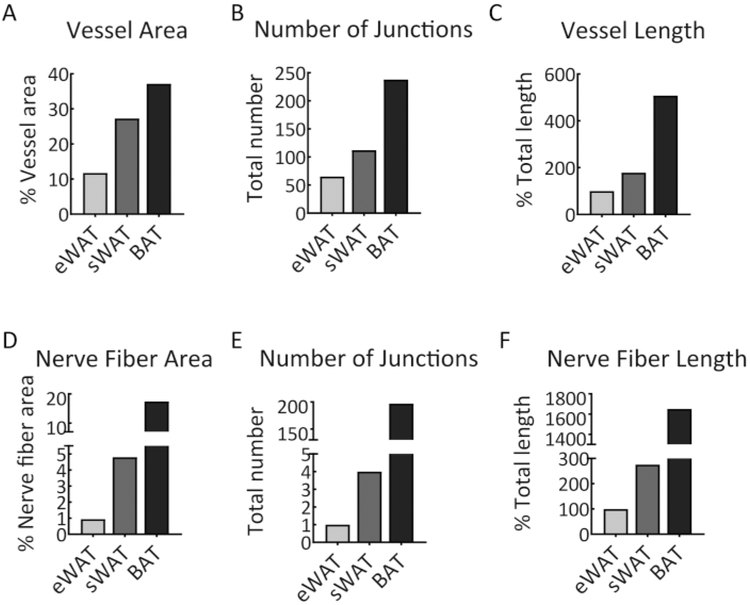
Figure 6: Quantitative analysis of vascular and nerve fiber networks.
(A) The percentage of blood vessel area in the samples of eWAT, sWAT, and BAT. (B) The number of junctions of the vascular networks in eWAT, sWAT, and BAT. (C) The total vessel length of vascular networks in eWAT, sWAT, and BAT. (D) The percentage of neve fiber area in the samples of eWAT, sWAT and BAT. (E) The number of junctions of the nerve fibers in eWAT, sWAT, and BAT. (F) The total length of nerve fibers in eWAT, sWAT, and BAT. The analyses were performed with 2D software. The results were achieved from the images presented in Figure 5.

