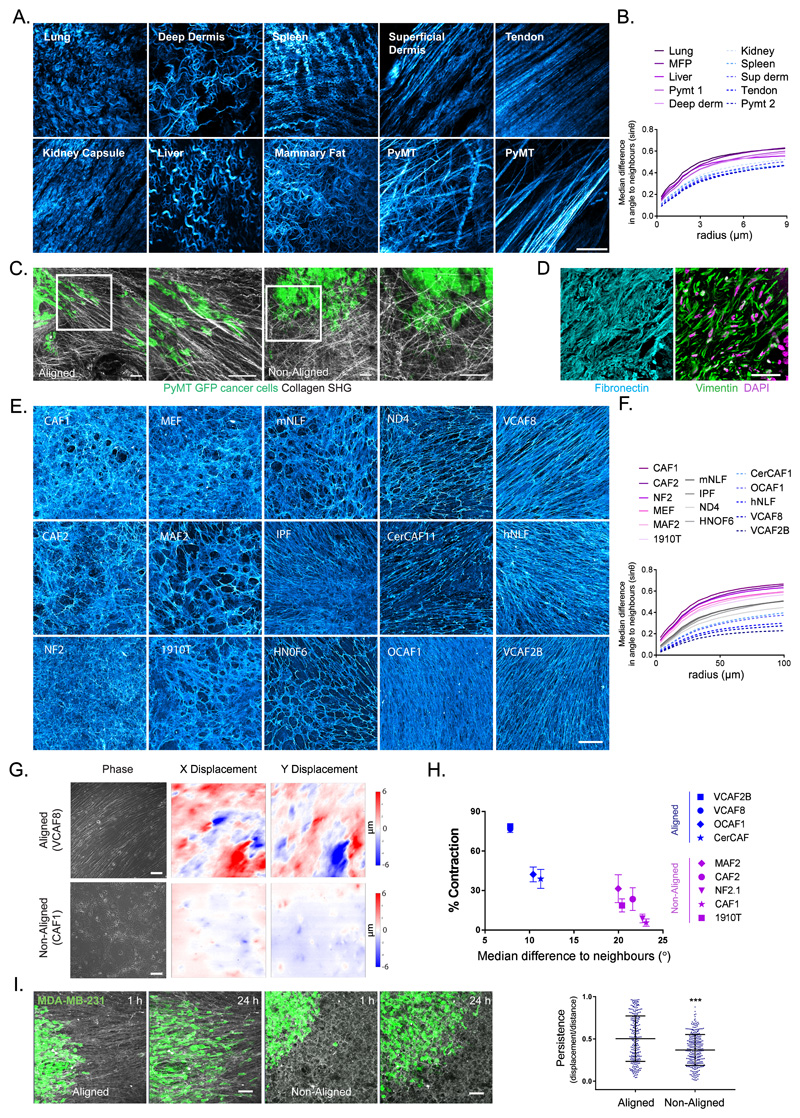
Figure 1. Extracellular matrix anisotrophy instructs cancer cell migration and enables the global co-ordination of force.
A. Collagen organisation in murine tissues imaged by second harmonic imaging (scale bar 20μm, representative image of 3 samples shown). B. Quantification of fibre alignment by median difference in angle to neighbours (sinθ) over expanding neighbourhoods (radii in μm). Higher values indicate greater disorder (images in A shown). C. Invasive patterns of PyMT-GFP tumour cells in aligned vs non-aligned collagen (visualised by second harmonic imaging - grey) (scale bar 100μm, representative images of three fields of view from two independent experiments shown). D. Human squamous cell carcinoma stained for fibronectin (cyan), vimentin (green) and DAPI (magenta) (scale bar 50μm, representative images from 6 individual samples). E. Panel of fibroblast derived matrices (FDMs) stained for fibronectin (cyan) (scale bar 100μm, representative images from three independent experiments shown). F. Quantification of ECM alignment of individual images in E. G. Traction force microscopy of aligned (VCAF8) and non-aligned (CAF1) fibroblasts at confluence, showing bright-field phase imaging of cell body organisation and substrate displacement in both x and y (scale bar 100μm, representative images of 5 fields of view from 2 independent experiments shown). H. Correlation analysis of collagen gel contraction with alignment metric (n=52 in total, from 2 independent experiments, mean and standard error of the mean (SEM) shown. Two tailed Pearson correlation test, r = -0.9187, p value= 0.0002). I. Migration of MDA-MD-23-GFP cells (green) on aligned (VCAF8 derived) or non-aligned (CAF1 derived) matrices over 24 hrs (scale bar =100μm, representative images from 3 independent experiments). Tumour cell persistence (displacement/distance) over 12 hr intervals (n=547 cells in total from 3 independent experiments, p<0.0001, two tailed unpaired t-test, bars indicate mean and standard deviation (SD)).

