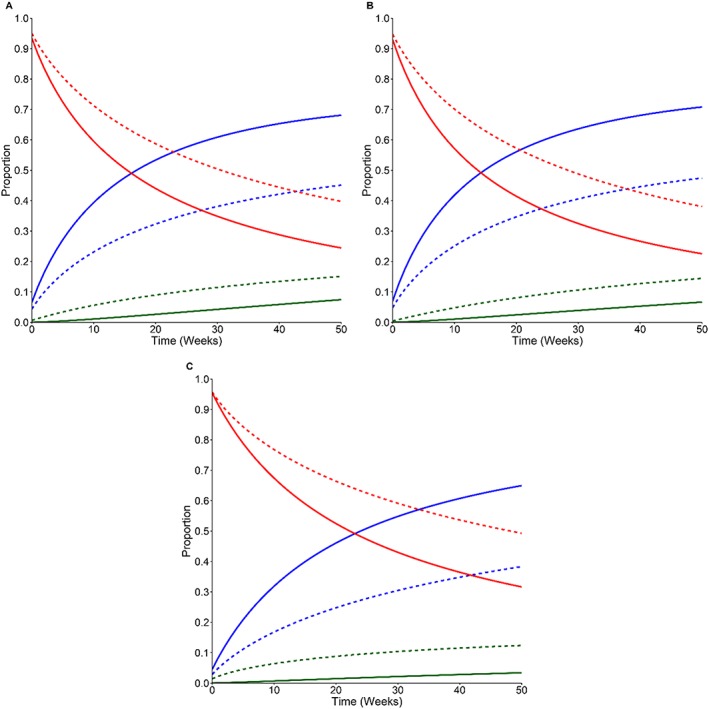
Figure 2.

The effect of treatment on patient disease state over time. The multinomial logistic regression predicted the proportion of patients in each of the three disease states (NYHA class I/II, blue line; NYHA III, red line; NYHA IV, green line) depending on the treatment being received (Optimizer + SoC, solid line; SoC alone, dashed line). (A) All patients, (B) 25–34% LVEF, and (C) 35–45% LVEF. The model predicted disease state when baseline age and LVEF were fixed at their respective means, sex was male, and patients were ischaemic and had diabetes. LVEF, left ventricular ejection fraction; NYHA, New York Health Association; SoC, standard of care.
