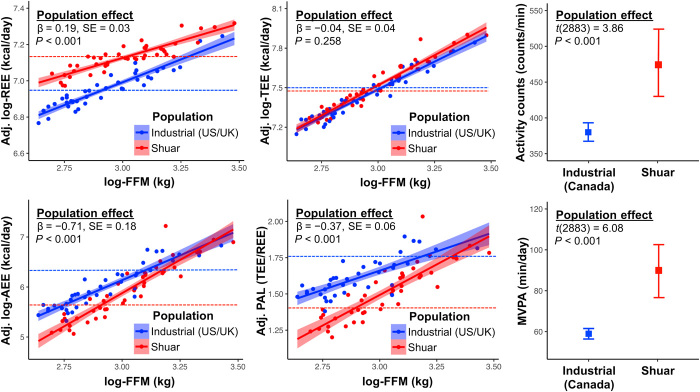
Fig. 2. Energy expenditure and daily physical activity measures for Shuar children (red) and industrialized cohorts (blue).
Scatterplot solid lines (shaded 95% confidence intervals) indicate regressions of energetic measures on log–fat-free mass (FFM) adjusting for age, sex, and log–fat mass (FM), with dotted lines denoting population estimated marginal means from final energetic models. Plots of accelerometry activity counts and MVPA display unadjusted population means (95% confidence intervals). No population difference was observed for TEE. However, Shuar children had greater REE, lower AEE and PAL, and greater activity counts and MVPA than industrialized references. MVPA, moderate-vigorous physical activity.

