
Fig. 3. Shuar total immunoglobulin G (IgG) concentration predicts child REE measures.
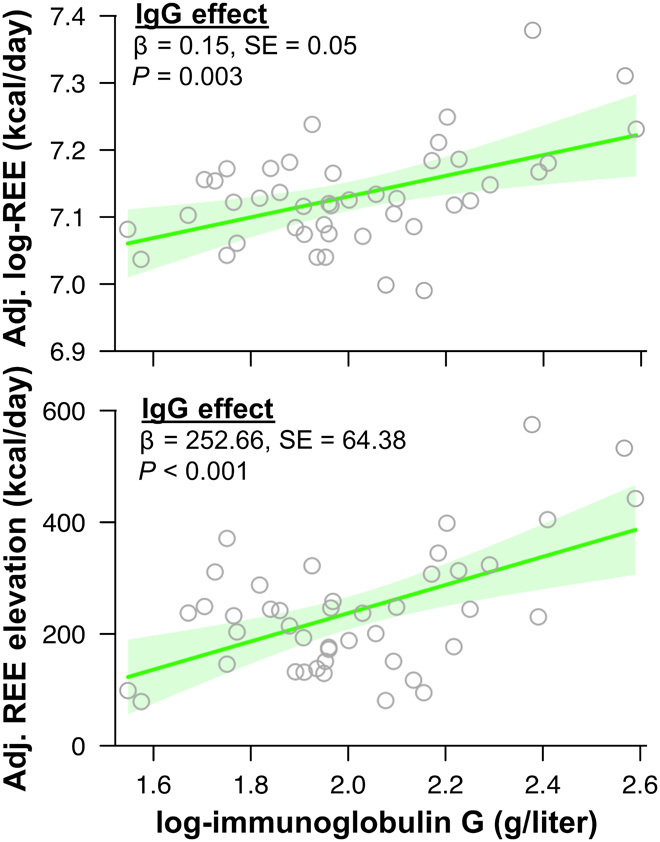
Shuar total immunoglobulin G (IgG) concentration versus measured REE (top) and REE elevation above predicted U.S./U.K. values (bottom). Solid lines (shaded 95% confidence intervals) indicate regression of log-IgG adjusting for age, sex, log-FM, log-FFM, and time of REE data collection (log-REE analysis) or time of REE data collection (REE elevation analysis). REE elevation was calculated as the difference between measured REE values and REE predicted from the best-fit model of the U.S./U.K. sample (R2 = 0.588, P < 0.001; adjusting for age, sex, log-FM, and log-FFM).