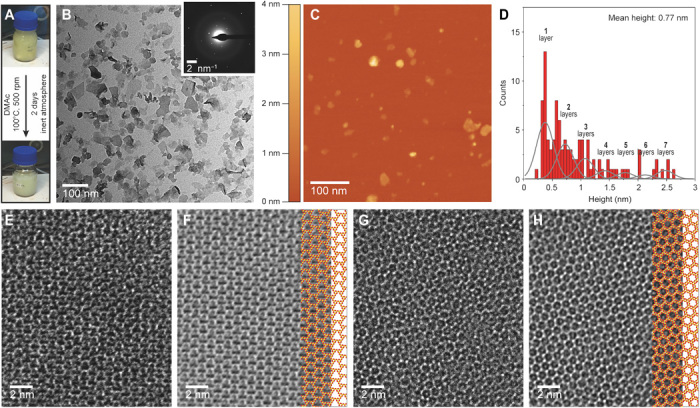
Fig. 2. Mild exfoliation of PTI.

(A) Diagram showing the color of the PTI dispersion before and after exfoliation. Photo credit: Luis Francisco Villalobos, École Polytechnique Fédérale de Lausanne. (B) Bright-field TEM image of the dispersion of PTI nanosheets after 2 days of exfoliation inside an anhydrous DMAc solution at 100°C and a centrifugation-based purification. Inset shows a SAED pattern of a PTI nanosheet. (C) AFM image of PTI nanosheets. (D) Nanosheet thickness histogram (n > 100). A sum of Gaussians with a full width at half maximum of 0.35 nm shows the approximate range of bins that correspond to each number of layers. (E) HRTEM image of a single-layer PTI nanosheet and (F) its corresponding filtered image with the structure of single-layer PTI superimposed (C and N atoms colored in red and yellow, respectively). (G) HRTEM image of a few-layered PTI nanosheet and (H) its corresponding filtered image with the structure of bilayer PTI superimposed (C and N atoms colored in red and yellow, respectively).
