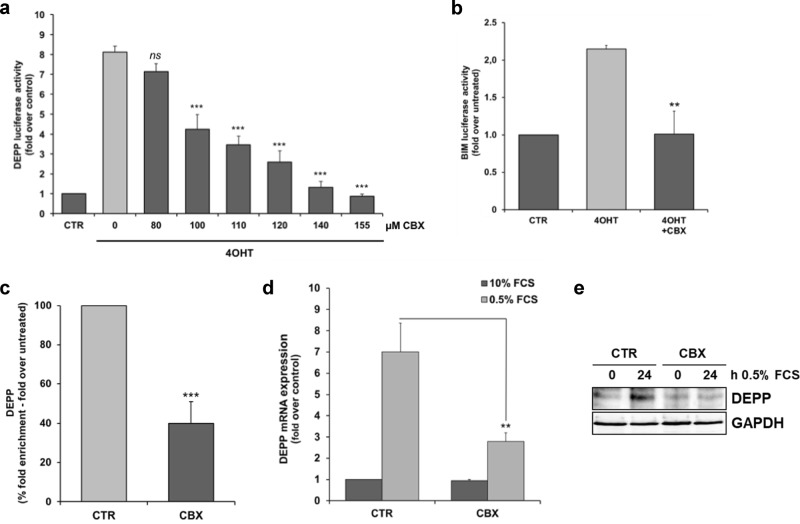
Fig. 3.
CBX interacts with the FOXO3-DBD and inhibits its transcriptional activity in NB cells. a The DEPP-promoter reporter plasmid was transfected into SH-EP/FOXO3 cells and a luciferase activity assay was performed. The cells were treated with 20 nM 4OHT to activate ectopic FOXO3(A3)ERtm and incubated with the indicated concentrations of CBX for eight hours. Direct binding of FOXO3 to the DEPP-promoter activates this reporter system as described before [40]. The increase of the luciferase signal was calculated as fold over untreated controls. Shown are mean values ± s.e.m. of three independent experiments; statistical analysis was done with the Student’s unpaired t test; ***p < 0.01 compared with 4OHT-treated cells. b A luciferase activity assay was performed in SH-EP/FOXO3 cells transfected with a BIM-promoter reporter plasmid. The cells were treated with 50 nM 4OHT alone or in combination with 140 µM CBX for eight hours. The increase of the luciferase signal was calculated as fold over untreated controls. Shown are mean values ± s.e.m. of three independent experiments; statistical analysis was done with the Student’s unpaired t test; **P < 0.025 compared with 4OHT-treated cells. c ChIP analyses were performed in SH-EP/FOXO3 cells treated with 100 nM 4OHT alone or in combination with 120 µM CBX for three hours. Binding of FOXO3 to the promoter region of DEPP was assessed by quantitative RT-PCR. Shown are mean values ± s.e.m. of three independent experiments. Statistical analysis was done with the Student’s unpaired t test; ***P < 0.01 compared with the 4OHT-treated control (%). d, e The impact of CBX treatment on FOXO3-dependent induction of DEPP expression in serum starved cells was analyzed by quantitative RT-PCR (d) and by immunoblot analyses (e). For quantitative RT-PCR analysis of DEPP expression, serum starved SH-EP cells (0.5% FCS) were treated with 80 µM CBX for 24 hours. Shown are means ± s.e.m. of three independent experiments. Statistical analysis was done with the Student’s unpaired t test, **P < 0.025 compared with the serum starved control. For immunoblot analyses, SH-EP cells were cultivated under serum starvation conditions (0.5% FCS) and incubated with 80 µM CBX for 24 hours. GAPDH served as loading control

