Fig. 1.
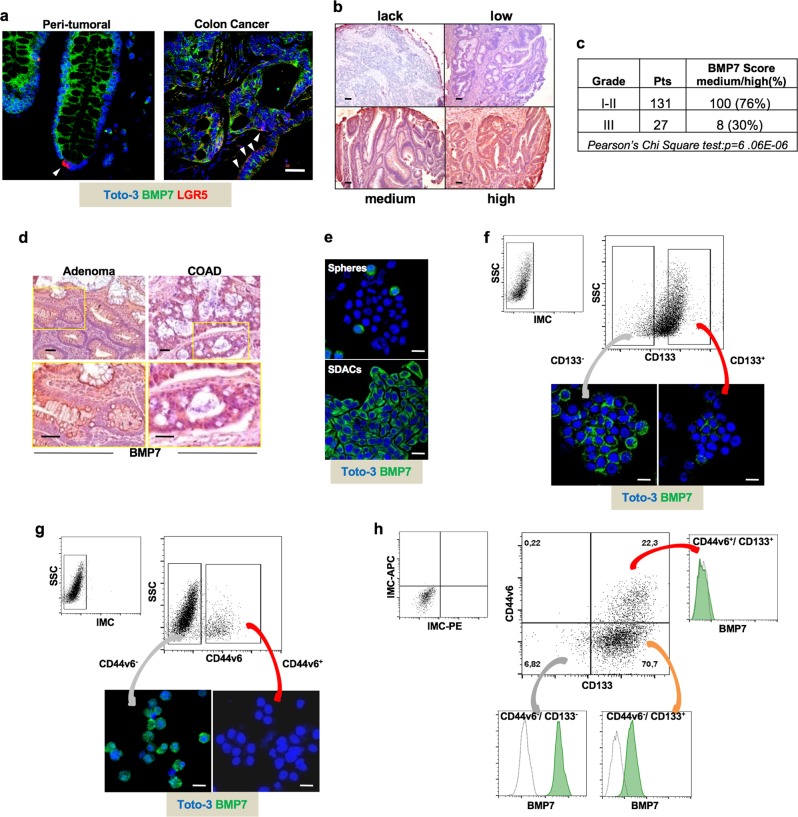
BMP7 is confined to differentiated CRC cells. a Immunofluorescence analysis of BMP7 (green color) and LGR5 (red color) on peritumoral mucosa and colon cancer paraffin-embedded tissues performed on CSC#8. One representative tumor from twenty different tumors examined is shown. Nuclei were counterstained by Toto-3 (blue color). White arrowheads indicate LGR5+ cells at the base of colon crypt. The scale bar represents 100 µm. b Immunohistochemical analysis of BMP7 on CRC TMAs in lack, low, medium, and high staining intensity (red color). Nuclei were counterstained by aqueous hematoxylin (blue color). The scale bar represents 100 µm. c Association of BMP7 expression with score medium/high and the pathological grading in CRC TMAs provided by TRISTAR technology group. d Immunohistochemical analysis of BMP7 (red color) in paraffin-embedded sections of colon adenomas and adenocarcinoma (COAD). Nuclei were counterstained by aqueous hematoxylin (blue color). The scale bar represents 100 µm. e Immunofluorescence analysis of BMP7 (green color) in CRC sphere cells and their differentiated progeny SDACs. One representative of fifteen different CR-CSC lines (CSC#1–3, 5–7, 10,11, 14–16, 18, 25, 33, and 40) is shown. Nuclei were counterstained by Toto-3 (blue color). The scale bars represent 20 µm. f Representative flow cytometry analysis of CD133 in CRC sphere cells and its relative isotype-matched control (IMC) (upper panels) performed on CSC#4, 8, and 23–26. Immunofluorescence analysis of BMP7 (green color) in CD133+ and CD133− enriched CRC sphere cell subpopulations (lower panels). Nuclei were counterstained by Toto-3 (blue color). The scale bars represent 20 µm. g CD44v6 expression profiles of cells as described in f (upper panels). Expression of BMP7 (green color) in CD44v6+ and CD44v6− enriched CRC sphere cell subpopulations assessed by immunofluorescence analysis (lower panels). Nuclei were counterstained by Toto-3 (blue color). The scale bars represent 20 µm. h Flow cytometry analysis of BMP7 (green histograms) in enriched CD44v6−/CD133−, CD44v6−/CD133+, and CD44v6+/CD133+ CRC subpopulations performed as shown in f. Dotted line histograms indicate the relative IMC

