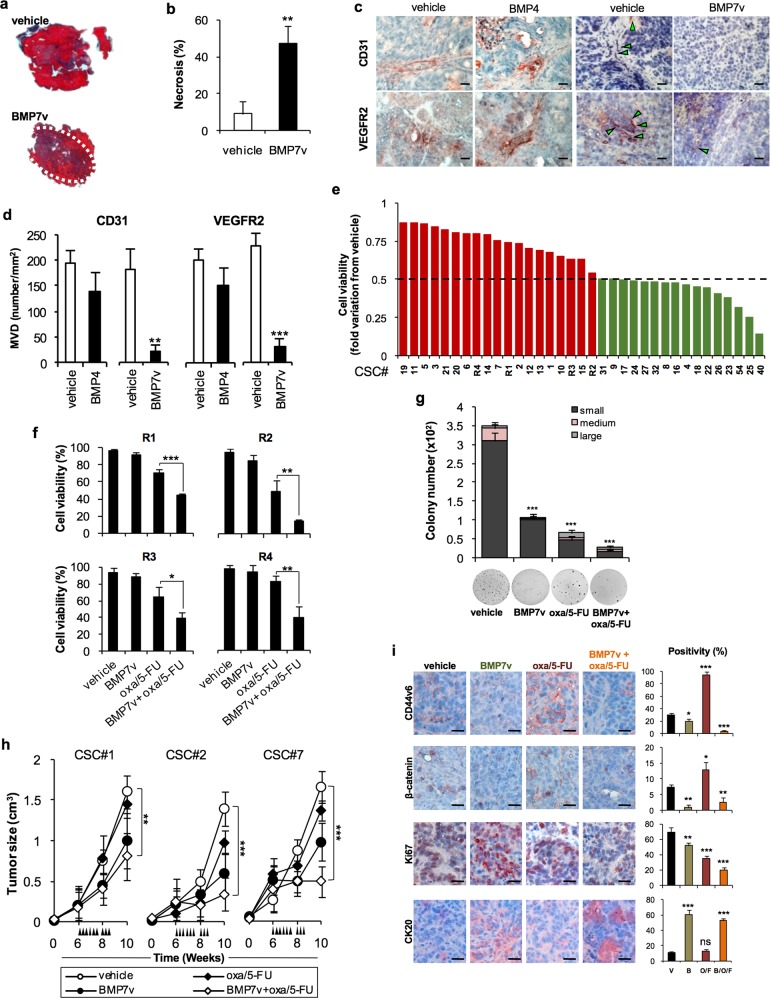
Fig. 4.
BMP7v exerts antiangiogenic effects and sensitizes chemoresistant CSCs to standard therapy. a Azan-Mallory staining on paraffin-embedded sections of xenografts derived from the injection of CRC sphere cells and treated for 4 weeks (6–9 weeks) with PBS (vehicle) or BMP7v. Data are representative of three independent experiments using different CRC sphere cell lines (CSC#2, 7, and 18). b Percentage of necrosis evaluated on paraffin-embedded sections of xenografts treated as in a. Data are shown as mean ± SD of three independent experiments. c Immunohistochemical analysis of CD31 and VEGFR2 (red staining) on paraffin-embedded sections of xenografts generated by the injection of CRC sphere cell lines and treated with PBS (vehicle), BMP4, or BMP7v. Green arrowheads indicate microvessels expressing CD31 or VEGFR2. Images are representative of three independent experiments using cells as in a. Nuclei were revealed by hematoxylin staining (blue). The scale bar represents 20 µm. d Number of microvessels positive for CD31 (left panel) and VEGFR2 (right panel) expression, evaluated on paraffin-embedded sections of xenografts treated as in c. Data are shown as mean ± SD of cells. MVD = microvessel density. e Fold change of viable cells in 35 CR-CSC lines treated with oxaliplatin/5-FU for 24 h. Dotted line indicates the threshold between chemoresistant (red) and sensitive CR-CSCs (green). f Cell viability percentage in chemoresistant CR-CSCs (R1-R4) pretreated with BMP7 for 3 days and with oxaliplatin/5-FU (oxa/5-FU) for additional 24 h as indicated. Data are shown as mean ± SD of three different experiments performed in the indicated R-CSCs. g Colony forming efficiency of CR-CSCs treated as in f and evaluated at 21 days. Representative soft-agar analyses are reported in the lower part of the graph. Bars show the mean ± SD of seven different CRC sphere cell lines (CSC#1–3, 5, 7, 10, and 18). h Tumor size of subcutaneous growth of the indicated CR-CSCs. Mice were treated for 4 weeks (6–9 weeks) with vehicle, oxaliplatin/5-FU (oxa/5-FU) and BMP7v alone or in combination. Error bars show the mean ± SD of tumor size measured in six mice/group. Black arrowheads indicate days of treatment. i Immunohistochemical analysis of CD44v6, β-catenin, Ki67, and CK20 (red color) in paraffin-embedded sections of CSC#7 xenografts treated as in h. Nuclei were counterstained by aqueous hematoxylin (blue color). The scale bar represents 20 µm (left panels). Percentage of CD44v6, β-catenin, Ki67, and CK20 positive cells in paraffin-embedded sections of tumor xenografts treated with vehicle (V), BMP7v (B), oxaliplatin/5-FU (O/F), alone or in combination (B/O/F) for 72 h. Error bars are mean ± SD of positive cell counts in three serial embedded-paraffin sections of six tumor xenografts per group derived from the injection of three different CRC sphere cells (CSC#1, 2, and 7) (right panels)

