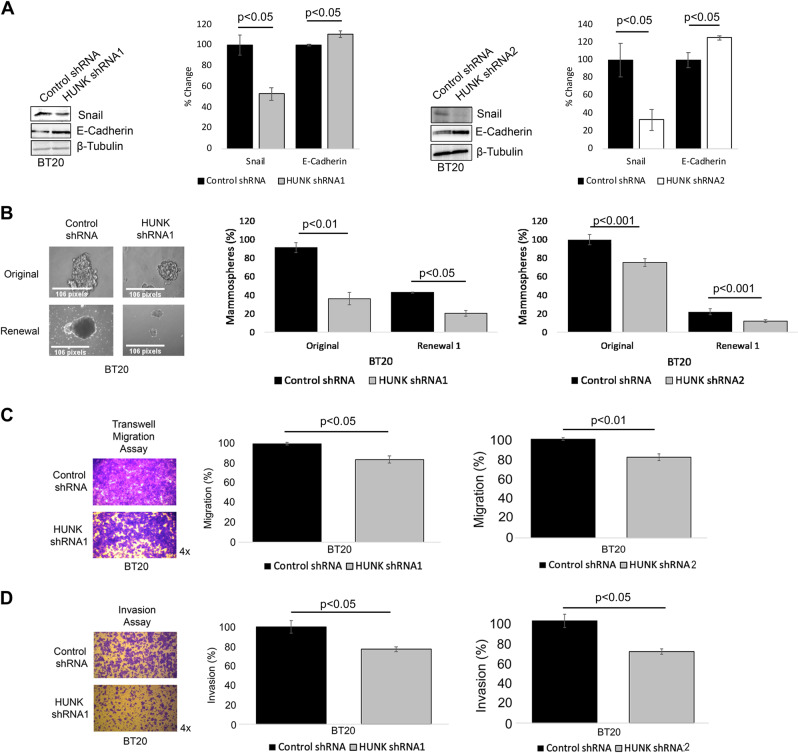
Fig. 3.
HUNK regulates EGFR-directed metastatic phenotypes in BT20 cells. a Western blot showing the expression levels of Snail (HUNK shRNA1 p < 0.05; HUNK shRNA2 p < 0.05), and E-Cadherin (HUNK shRNA1 p < 0.05; HUNK shRNA2 p < 0.05) in control, HUNK shRNA1, and HUNK shRNA2 BT20 cells. b Mammosphere formation assay of 500 control, HUNK shRNA1, and HUNK shRNA2 BT20 cells at original/day 7 (HUNK shRNA1 p < 0.01; HUNK shRNA2 p < 0.001) and renewal/day 14 (HUNK shRNA1 p < 0.05; HUNK shRNA2 p < 0.001). c Transwell migration (HUNK shRNA1 p < 0.05; HUNK shRNA2 p < 0.01) and (d) invasion (HUNK shRNA1 p < 0.05; HUNK shRNA2 p < 0.05) assays showing cell migration and invasion of 250,000 control, HUNK shRNA1, and HUNK shRNA2 BT20 cells after 24 h. All graphs show mean ± SEM (n = 3 for a–c, n = 4 for d)

