
Figure 5.
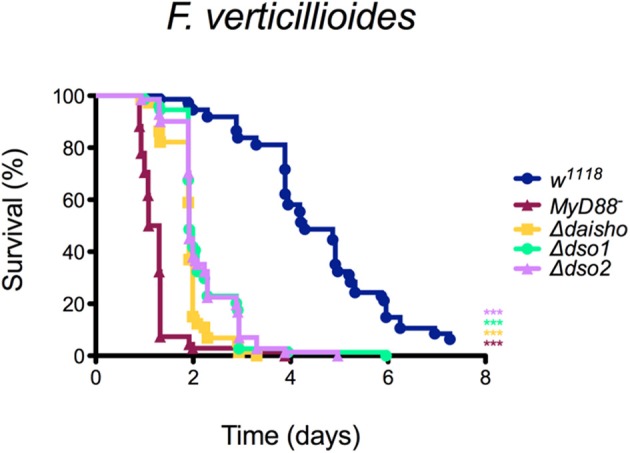
Survival of Δdso1 and Δdso2 against F. verticillioides. Shown is the combination of three independent experiments with 20–25 flies per genotype per experiment. Survival curves were compared using the Gehan-Breslow-Wilcoxon test. Significance is shown relative to w1118 (***p < 0.0001).