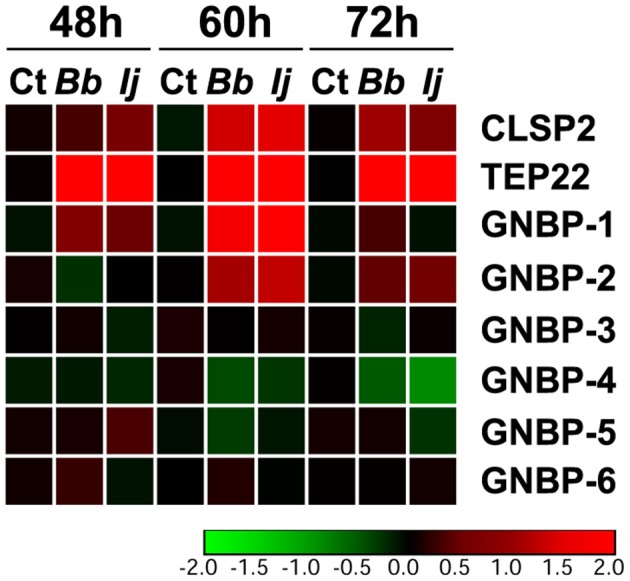
Figure 4.

Temporal elicitation of GNBPs and other fungal recognition molecules. Heatmap generated from the gene expression patterns of GNBPs, TEP22, and CLSP2 at 48, 60, and 72 h PI. Heatmap represents the median log2 fold change values from two independent experiments. The color red represents upregulation and green downregulation in comparison to the controls.
