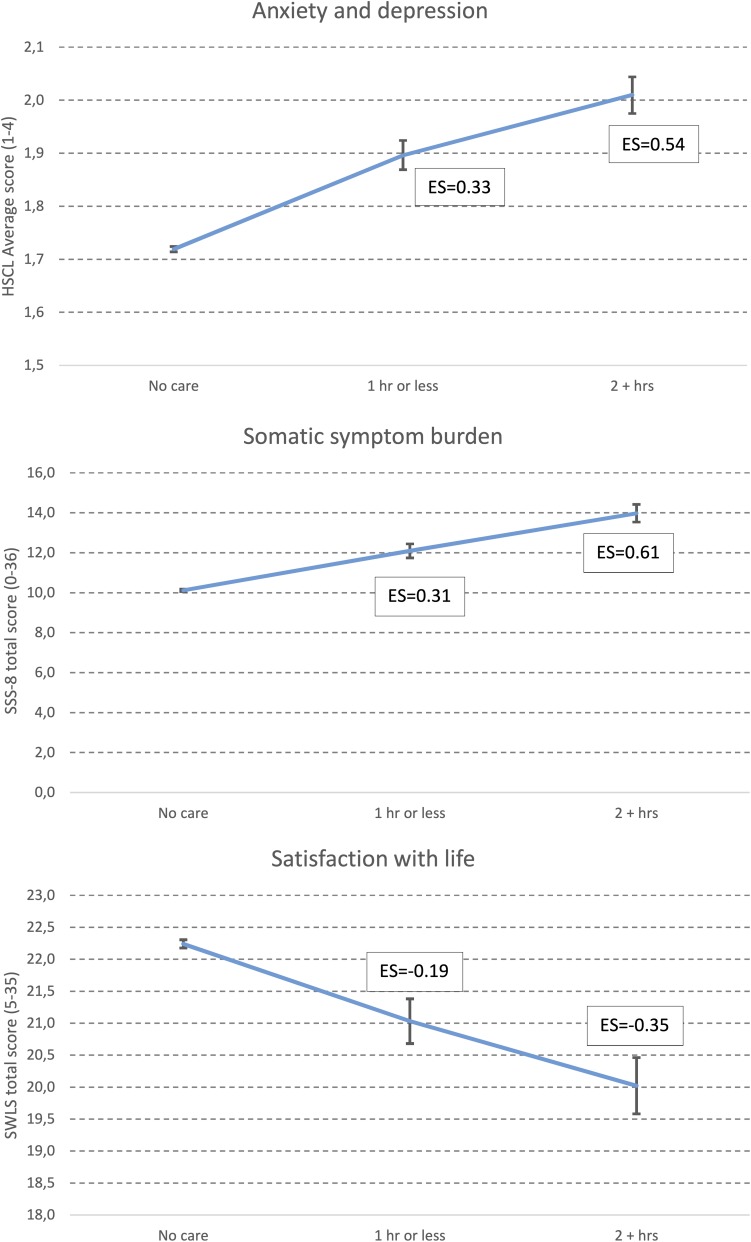
FIGURE 3.
Level of anxiety and depression (HSCL-25), somatic symptom burden (SSS-8), and satisfaction with life (SWLS). Values represent Estimated Marginal Means (EMM), adjusted for age, marital status, accommodation status, divorced parents, and financial difficulties and immigrant status. Error bars represent 95% confidence intervals of odds-ratios. Text boxes represent Cohen’s d effect sizes (ES), compared with “no care”.

