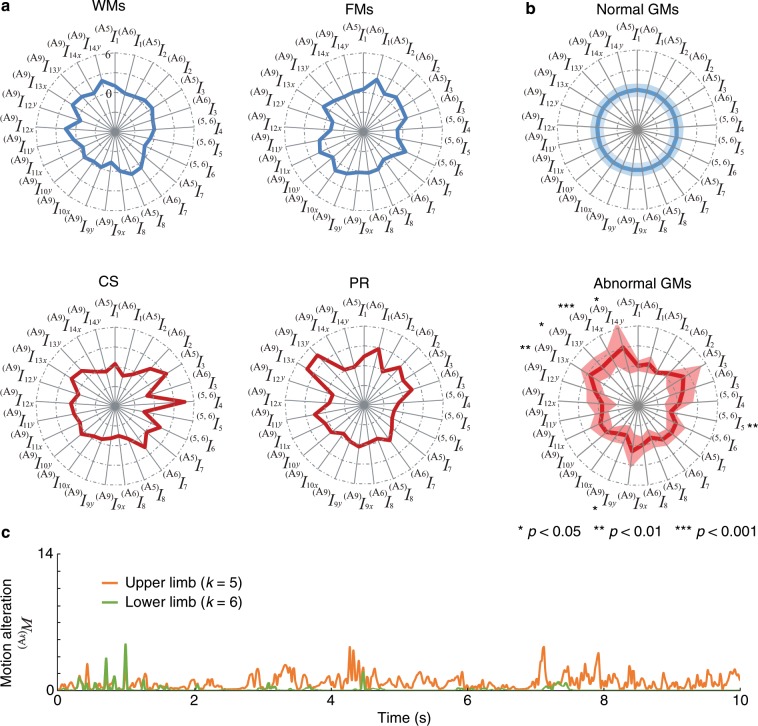
Figure 4.
Results of motion analysis. (a) Examples of the radar charts of evaluation indices for each GM: WMs, FMs, CS, and PR. (b) Averaged radar charts of evaluation indices for normal and abnormal GMs. Solid lines and shaded areas represent the mean values and the standard deviations for all subjects, respectively. The statistical test results based on the unpaired two-tailed t-test are also shown. (c) Changes in movement and of CS.

