Figure 6.
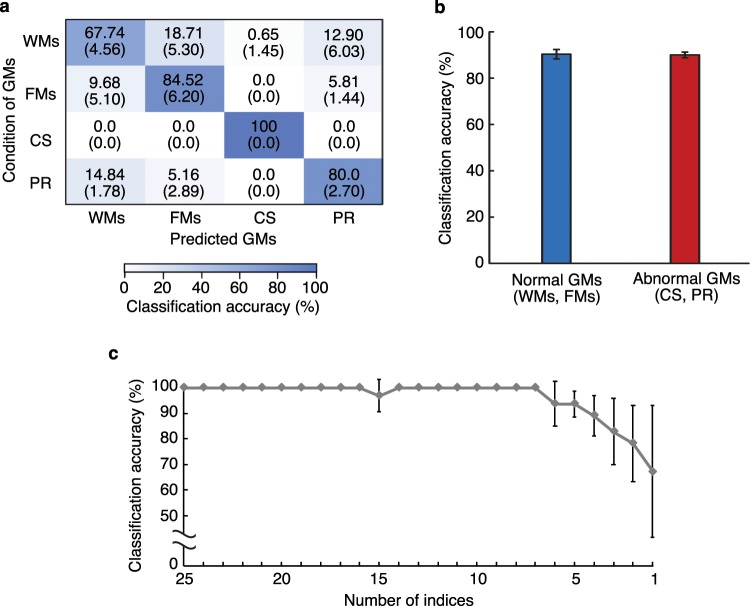
Classification results of the GMs. (a) Confusion matrix for the classification of four GM classifications. The rows and columns correspond to the PT assessments and the classification results of the system, respectively. Results averaged across five trials and standard deviation is shown. (b) Classification accuracy of normal GMs and abnormal GMs. Error bars represent standard deviations for all trials. (c) Classification accuracy of learning data for each number of indices. The input indices are reduced one-by-one using partial KL information. Error bars represent the standard deviations of the average classification accuracy of the respective GMs.

