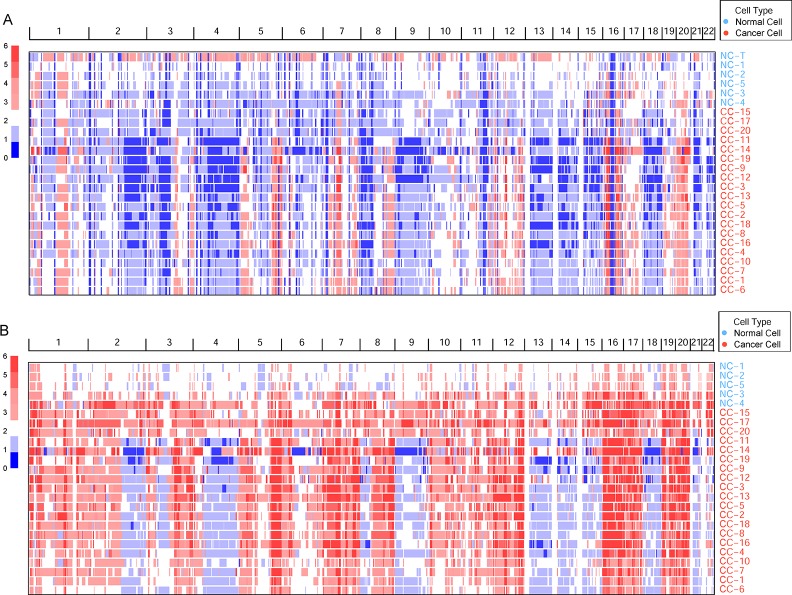
Figure 1.
The genomic copy number variations (CNVs) identified across all cells. (A) The germline CNVs in single cells and normal tissue. Genomic CNVs within the whole genome are shown, the color scale ranges from blue (deletion) to red (amplification) with estimated copy numbers shown. The cell names are marked by different cell types. (B) The somatic CNVs in single cells.

