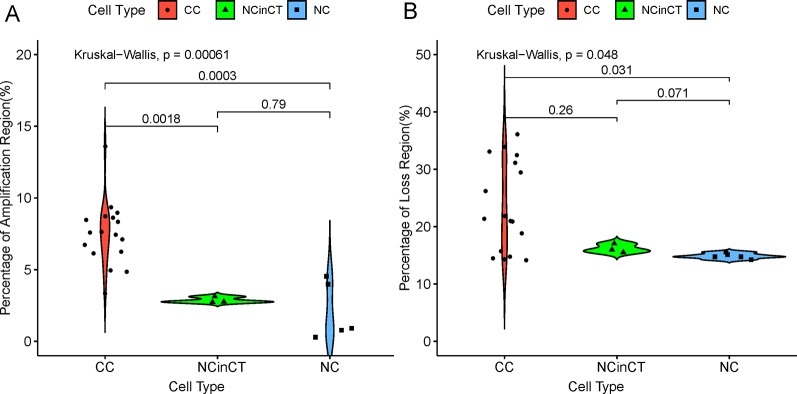
Figure 3.
The coverage of genomic copy number variations (CNV) regions in three cell types. (A) The percentage of amplification region (copy number ≥ 4) across the whole genome in different cell types. (B) The percentage of loss region (copy number = 0) across the whole genome in different cell types. In the two sub-graphs (A) and (B), p-values between two groups (Wilcoxon signed-rank test) and all groups (Kruskal-Wallis test) were calculated.

