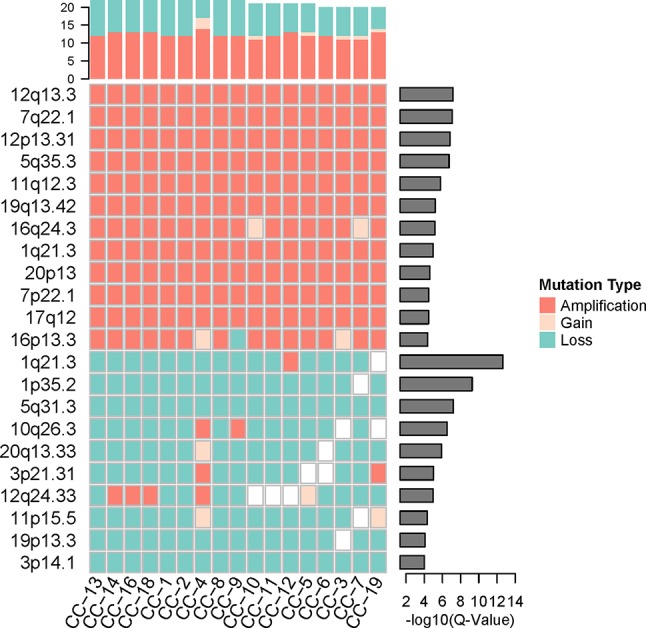
Figure 4.

The significant genomic copy number variation (CNV) loci in cancer cells. All CNV types in each cancer cell were counted for the top frequency histogram, and q-value for each significant genomic CNV loci was shown on the right. Only the loci with q-value < 0.0001 were shown.
