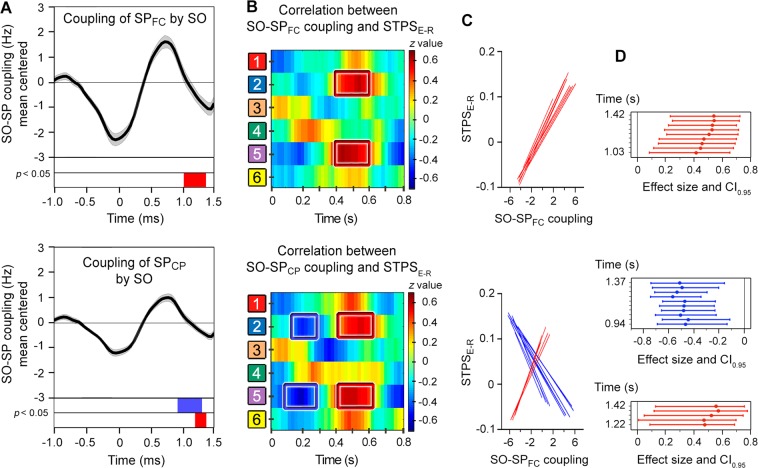
Figure 5.
The relationship between SO-SP coupling during post-training sleep and encoding-retrieval STPS. (A) Event correlation histogram between frontocentral SOs and fast SPs localized over frontocentral (top) and centroparietal electrodes (bottom) averaged across all participants. The blue and red boxes indicate the time intervals where SO-SP coupling was negatively and positively correlated with the encoding-retrieval STPS, respectively. Note that correlations were significant in the up-state-to-down-state transition, although they did not survive multiple testing (puncorrected < 0.05). (B) Pearson correlation coefficients between SO-SP coupling and the encoding-retrieval STPS for remembered paired-associates at one representative time point of the SO up-state (1.32 s for both frontocentral and centroparietal SPs). The blue and red squares refer to clusters showing significant negative and positive correlations that did not survive FWE correction (puncorrected < 0.05), respectively. (C) Regression slopes of significant correlations for both frontocentral (top) and centroparietal SPs (bottom). (D) Effect sizes (Pearson’s r) and CI0.95 of significant correlations.

