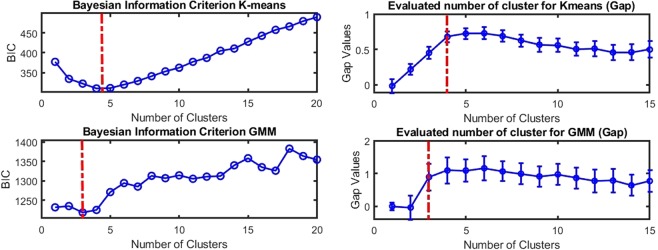
Figure 2.
Bayesian inference criterion (BIC) (left) and gap criterion (right) as a function of the number of clusters for K-means (top row) and GMM (bottom row). The minimum of the BIC and maximum of the gap criterion (highlighted in the red dash-dotted line) correspond to the optimal number of clusters in our data. Interestingly K-means and GMM are best described with 3 or 4 clusters which fit with the red dotted lines corresponding to the number of classes from the clinical taxonomy.

