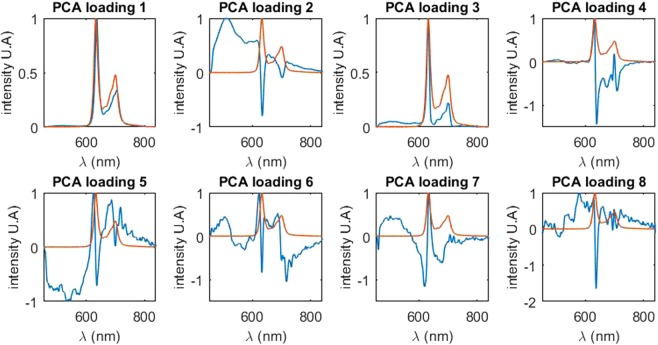
Figure 4.
Normalized principal component of the PCA (in blue) in the original feature space (i.e. the optical spectrum space). For each principal component, the reference spectrum of the PpIX (for the state peaking at 634 nm) is also plotted (in red). For better comprehension, only one of the three fluorescence emission spectrum from the original feature space is represented as they are similar for all three excitation wavelengths. The first principal component is similar to the spectrum of the PpIX with a peak of 636 nm. The second principal component is best described as the autofluorescence of the measured tissue, i.e. the contribution of other fluorophores. The five following components all show a peak shifting between 620 nm and 636 nm.

