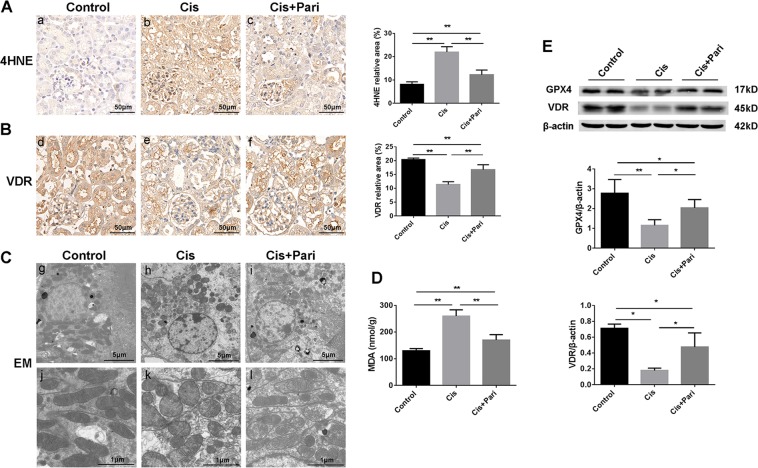
Fig. 4. VDR agonist paricalcitol attenuated ferroptotic phenotype changes and mitochondrial injury induced by cisplatin.
A Cortex expression of 4HNE determined by immunohistochemical staining after 48 h of indicated treatment, and the statistical analysis of the positive expression rate of each group (a–c). Scale bar = 50 μm. B The expression of VDR on renal tissue (d–f) were determined by immunohistochemical staining after 48 h of cisplatin with paricalcitol pretreatment, followed by the semi-quantitative statistical analysis of each group. Scale bar = 50 μm. C Representative images of mitochondrial injury at 48 h under indicated treatment were observed by TEM. Scale bar = 5 μm in g–i. Scale bar = 1 μm in j–l. D Quantitative analysis of the expression levels of MDA in kidney tissues of the three indicated groups. E Western blots analysis of GPX4 and VDR in renal tissue lysates from these three groups. The ratio of the optical density of GPX4 and VDR to β-actin were statistically analyzed. The data are presented as the mean ± SD, *P < 0.05, **P < 0.01, n = 8.

